Museformer: Transformer with Fine- and Coarse-Grained Attention for Music Generation
Introduction
In this page, we will show:
- Similarity Distribution on Different Datasets: to show the generalization of the structure-related bar selection to other genres and datasets.
- Similarity Distribution on Generated Music: to provide an objective comparison about music structures among Museformer and the baseline models.
- Self-Similarity Matrix of Demos: to visualize the music structures of the demos and to demonstrate that Museformer does not simply copy but can generate variations.
Similarity Distribution on Different Datasets
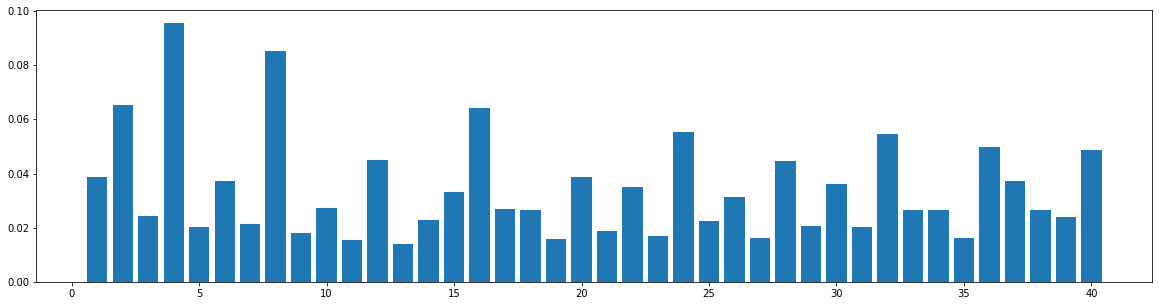
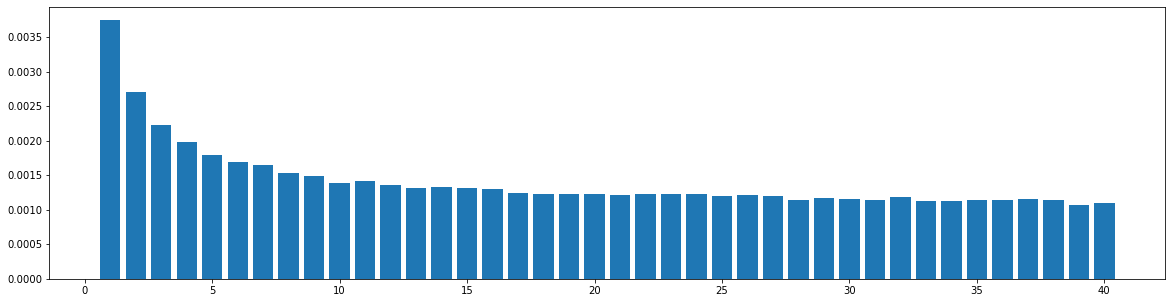
To see the music structures of different genres and datasets and check whether our structure-related bar pattern is widely applicable, we do the similarity statistics: We compute the similarities between each pair of bars within a song, and see the similarity distribution with respect to the distance between two bars. Here, the similarity is defined as the number of the common notes over the size of the union set of notes of the two bars, so its value should range from 0.0 to 1.0. Two notes are considered equal when their onsets within their bars, pitches, and durations are all the same. For each song, we would obtain a self-similarity matrix, whose size is num_bars X num_bars. Then, we compute the similarity distribution with respect to the distance between two bars, which shows the average value of similarities between two bars at each specific distance. The datasets and the results are as follows.
LMD (TopMAGD)
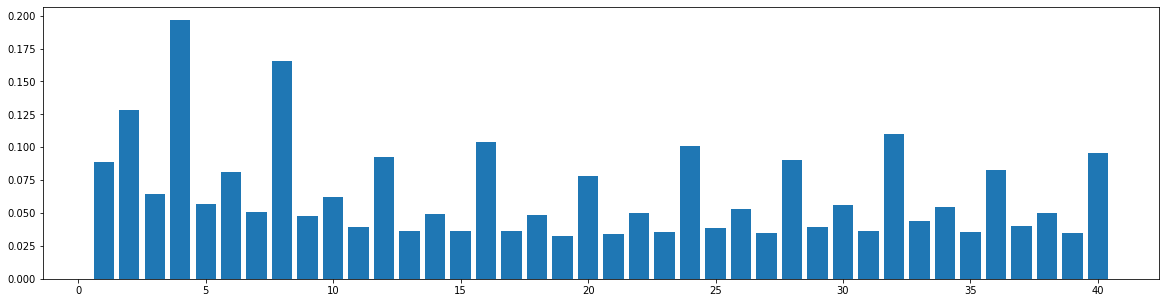
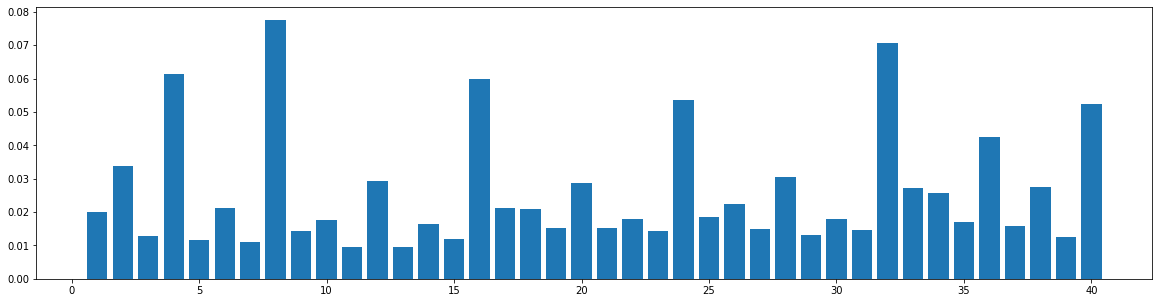
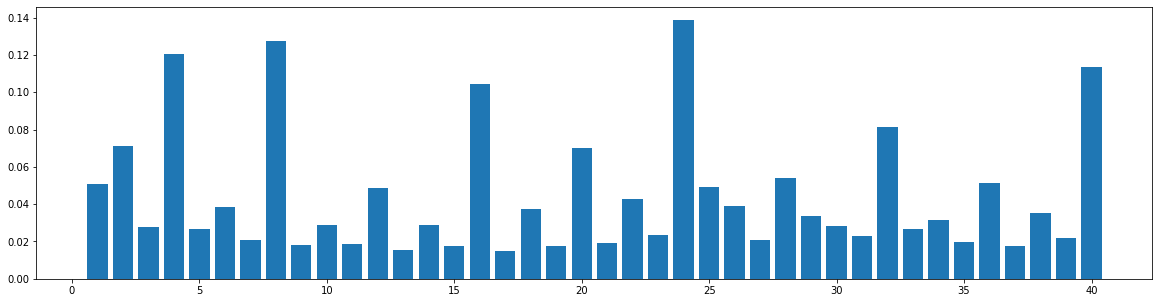
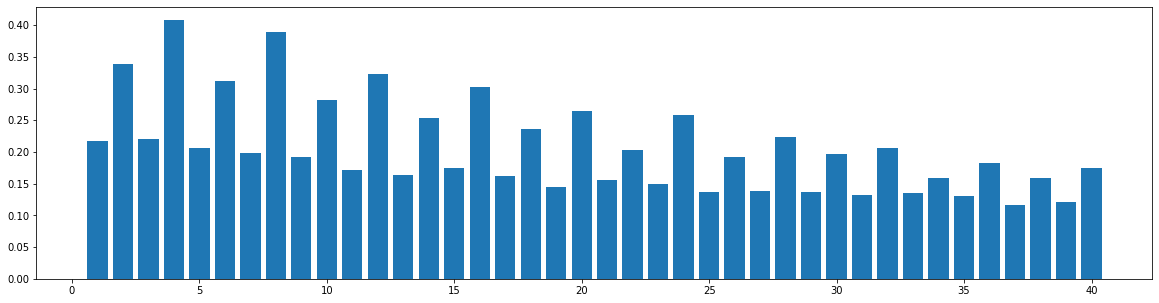
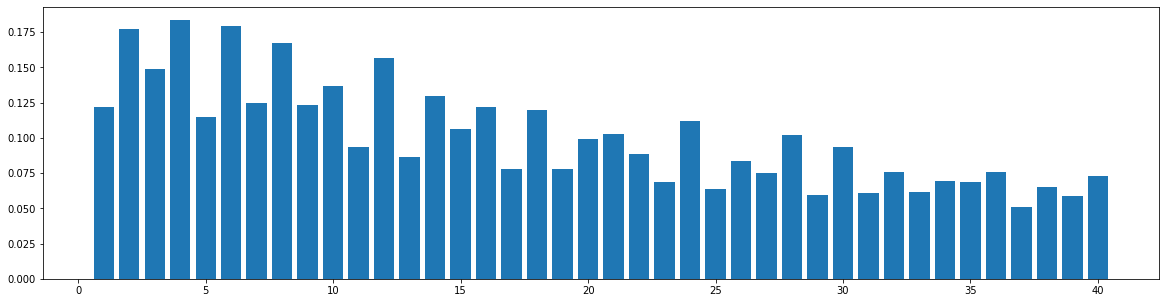
The widely used MIDI dataset, Lakh MIDI (LMD), contains songs of various genres. The TopMAGD dataset annotates the genre labels to many songs, a part of which is matched to songs in LMD. There are altogether 13 genres: Pop/Rock, Electronic, Rap, Jazz, Latin, R&B, International, Country, Reggae, Blues, Vocal, Folk, and New Age. We utilize the genre labels provided by TopMAGD to sort the LMD songs, and then do the statistics for each genre. The similarity is computed for the melody track. The results are shown below. Note that we omit the similarity when distance is 0, since it is always equal to 1. These 13 genres should cover most songs we listen to in daily life. As you may see from the figures, for all of the genres, the similarities at distance 1, 2, and multiples of 4 are generally higher than others, which means music tend to repeat or largely refer to previous bars at these distances. This demonstrates our selection of the structure-related bars in the paper, i.e., the previous 1st, 2nd, 4th, 8th, 16th, 24th, 32th bars are selected as the structure-related bars and are directly attended to via the fine-grained attention, is general to various of genres.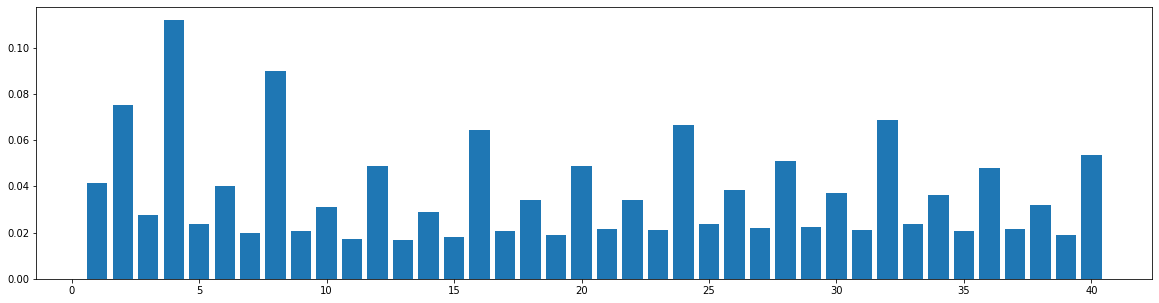


Symphony
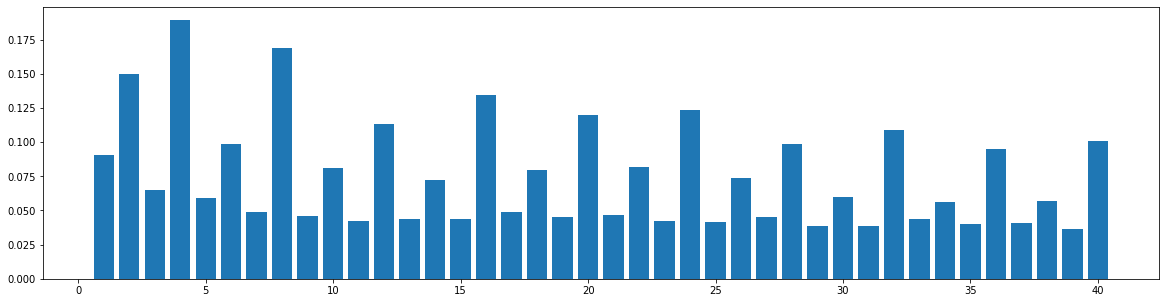
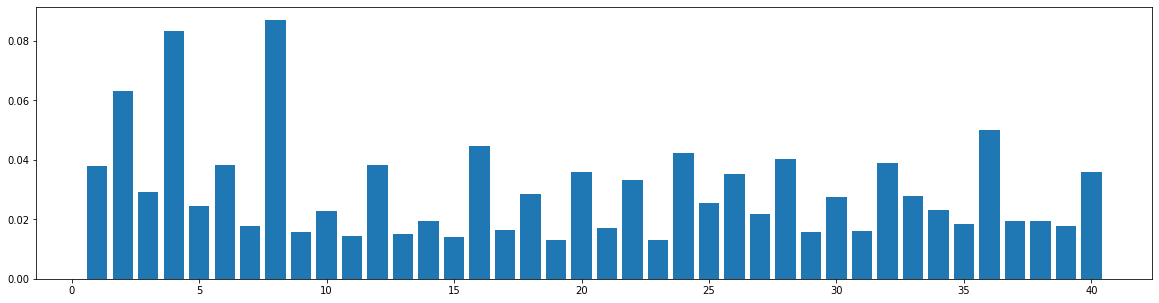
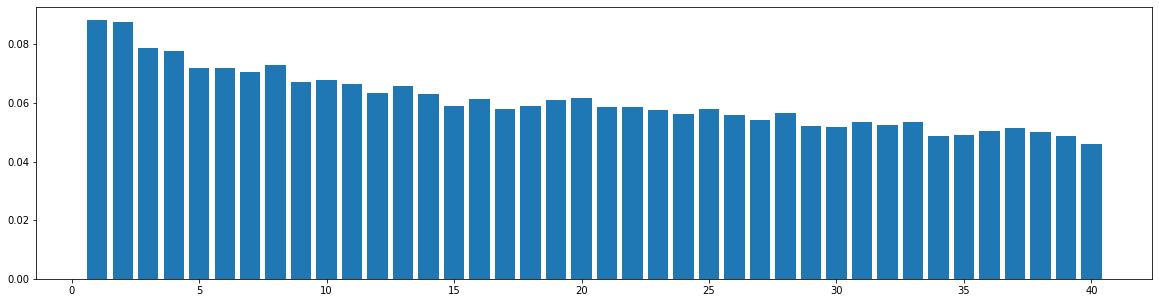
We also do the same statistics on a large-scale symphony dataset. This dataset is composed of classical and contemporary multi-track symphony performances. Since it is hard to tell which is the melody track of a symphony performance, we use the average similarity over all the tracks. The results are shown in the following figure. It shows that our structure-related bar selection can also be reasonably applicable to this dataset.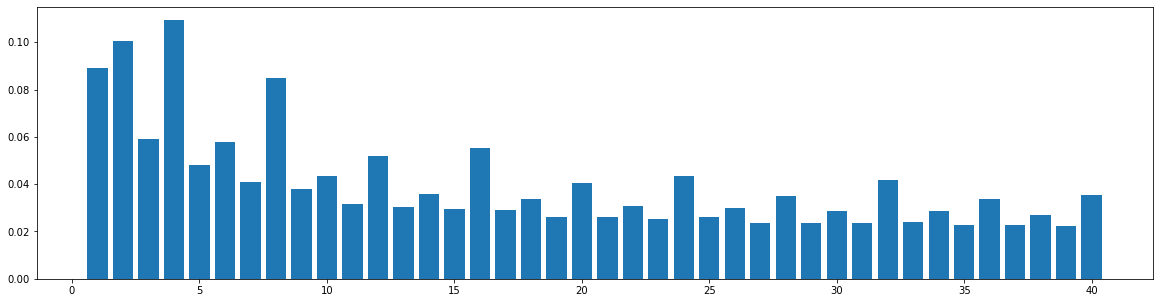
In conclusion, through these statistics results, we can see that our structure-related bar selection can generalize to other genres and datasets, and should cover most of the music we involve with in our daily life. Note that we only chose 8 bars as the structure-related bars in our paper is because it is a trade-off between model performances and efficiency. Our high-level idea that fine-grained attention is for important contents and coarse-grained attention is for other contextual information, is universally fittable for music data. Our model can be easily adapted to more structure-related bars or even any other music structures by simply changing a set of hyperparameters in the implementation.
Similarity Distribution on Generate Music
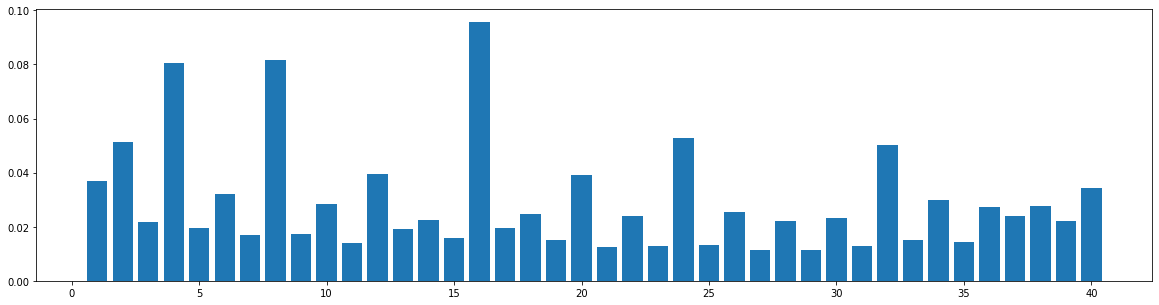
Using the same method described in the last section, we compute the bar-pair similarity distribution on 100 music pieces generated by each model (Museformer and the baseline models). The result is as follows:


Self-Similarity Matrix of Demos
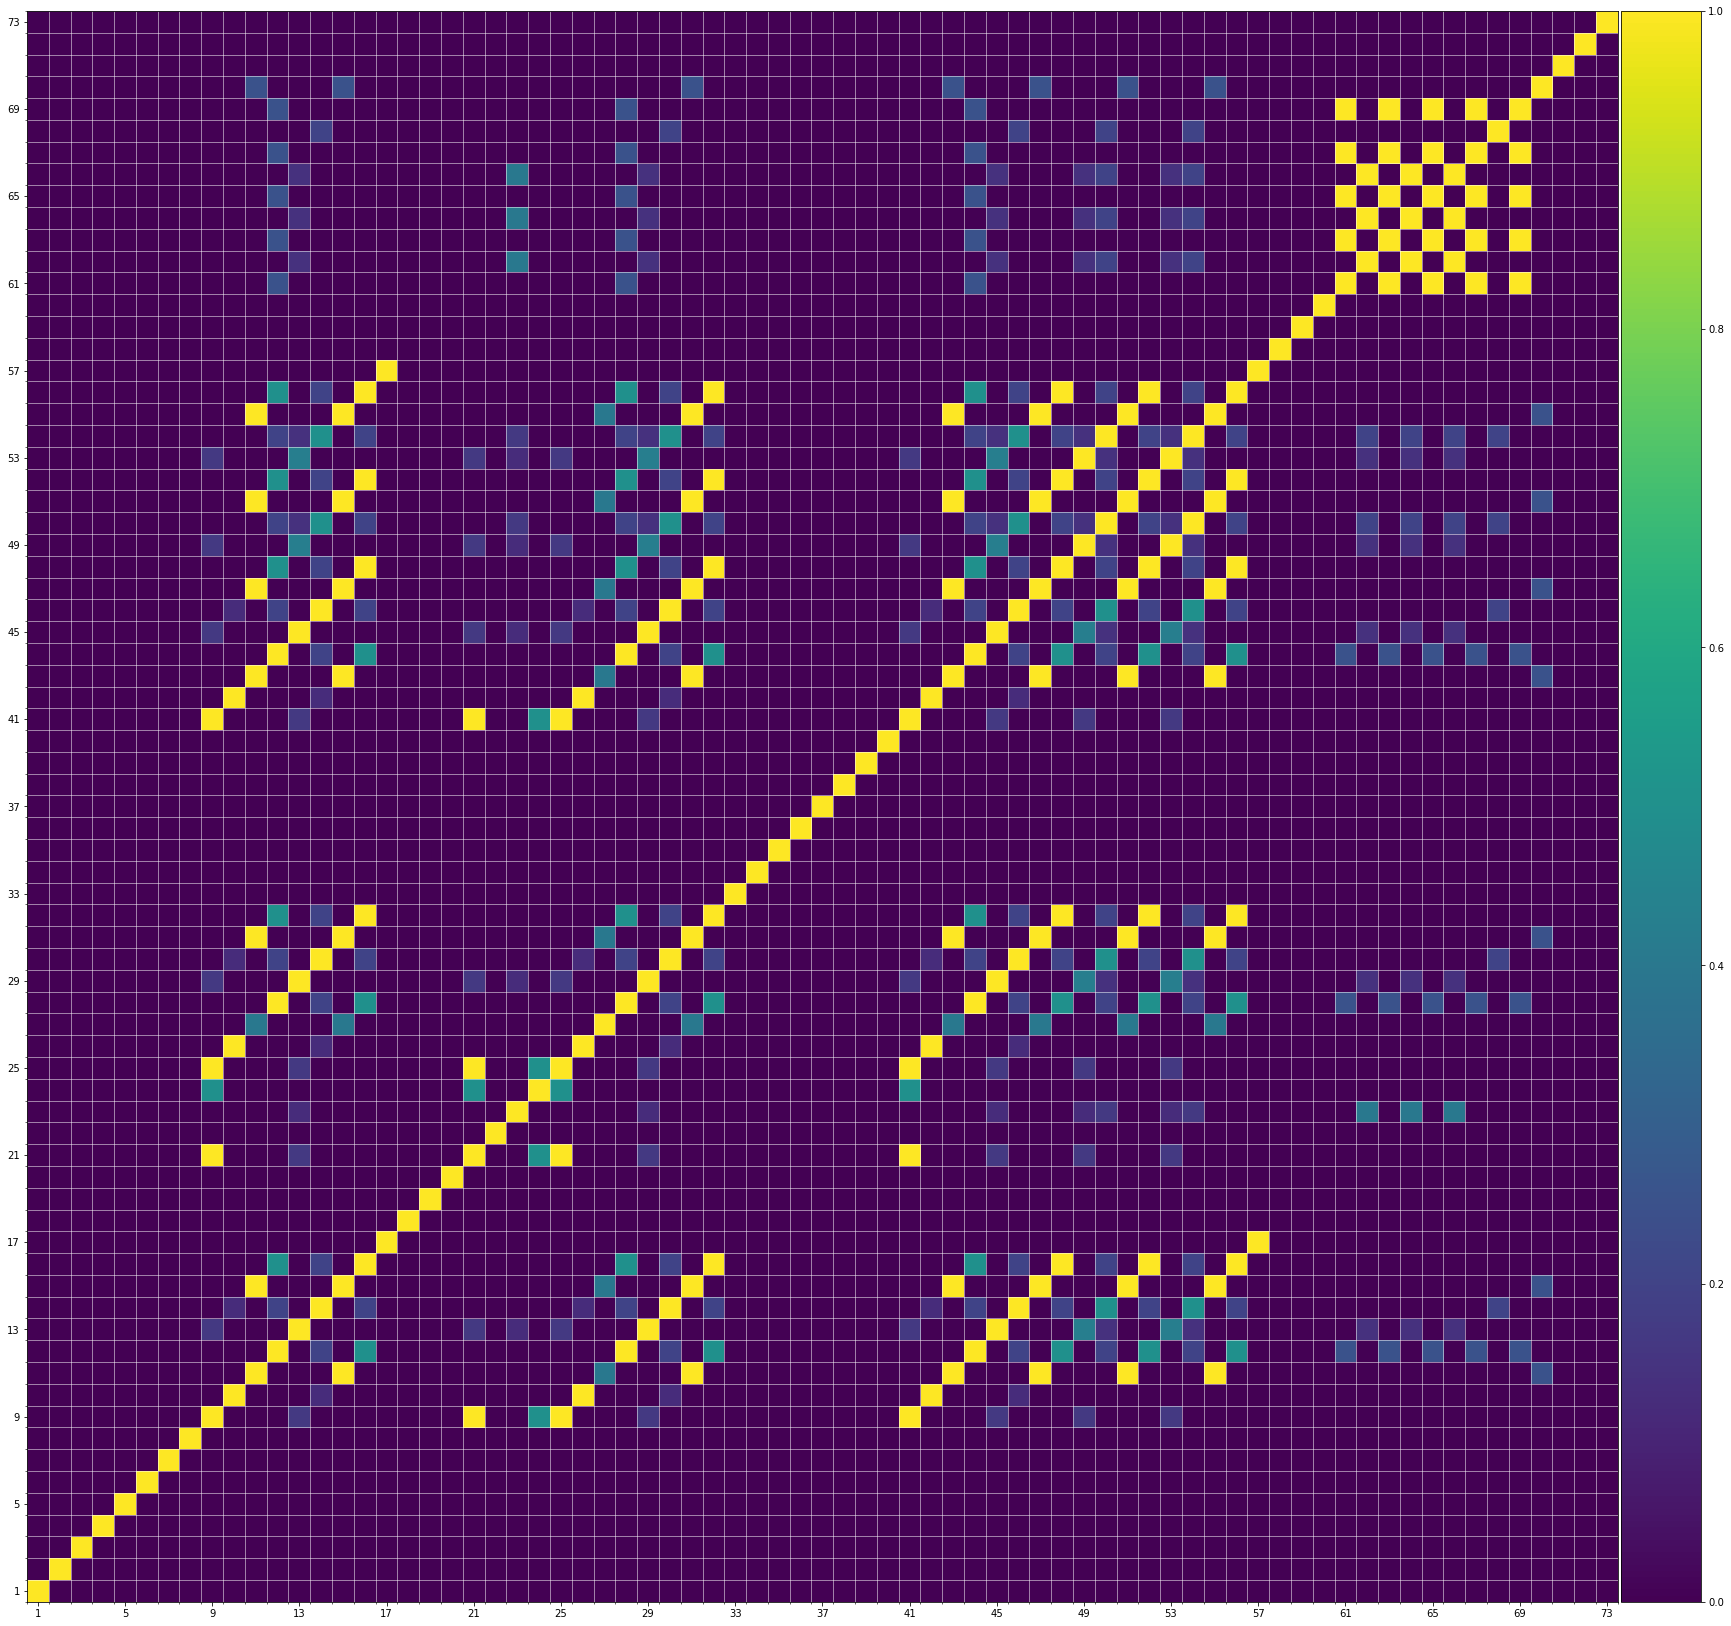
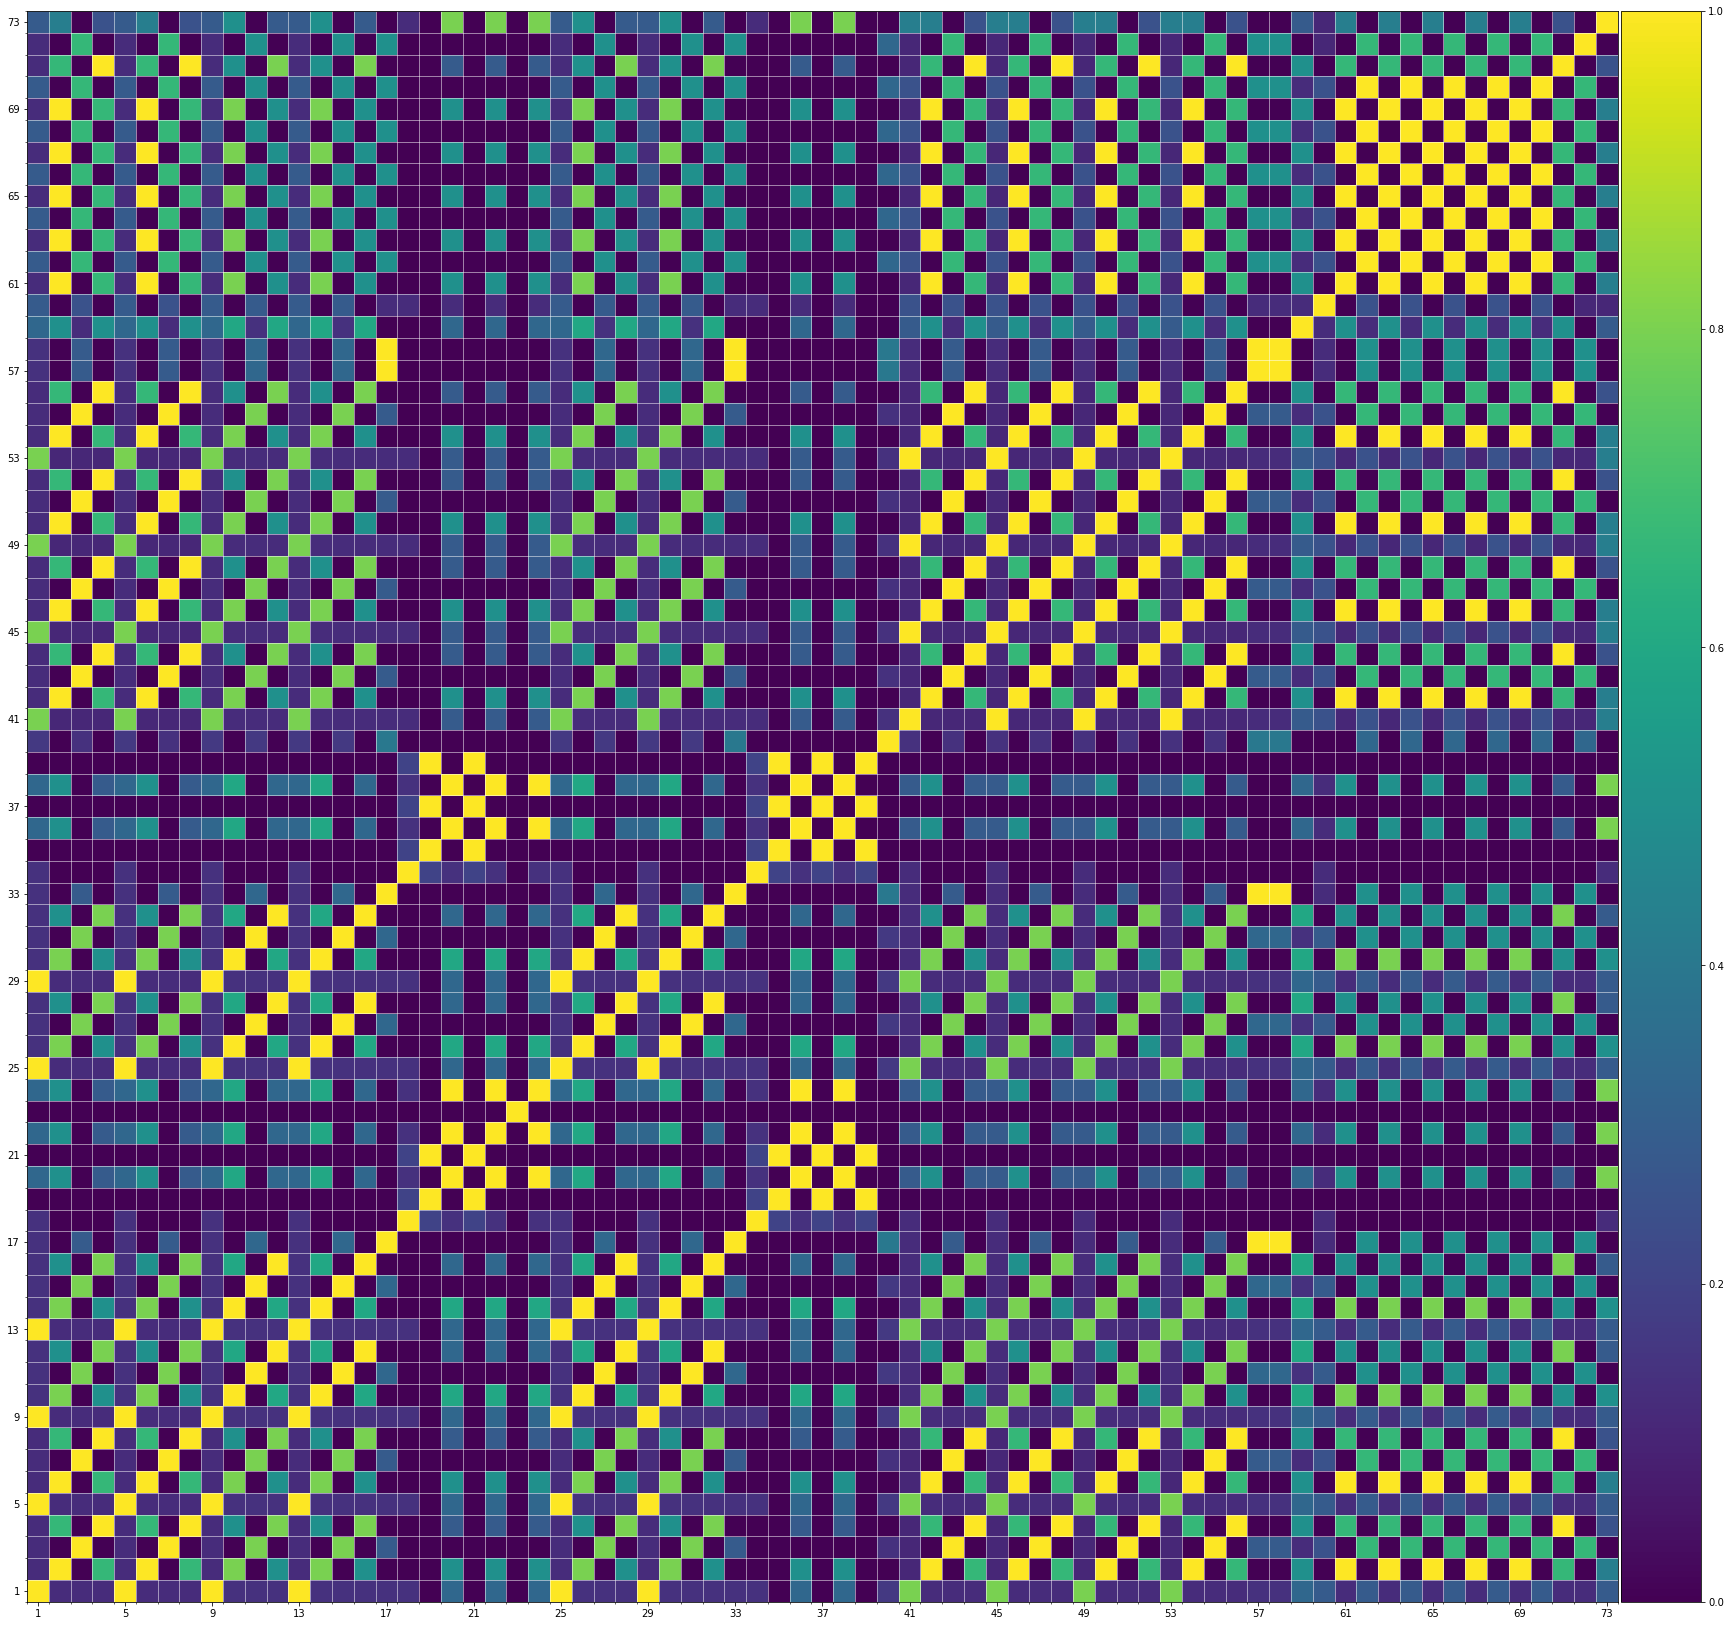
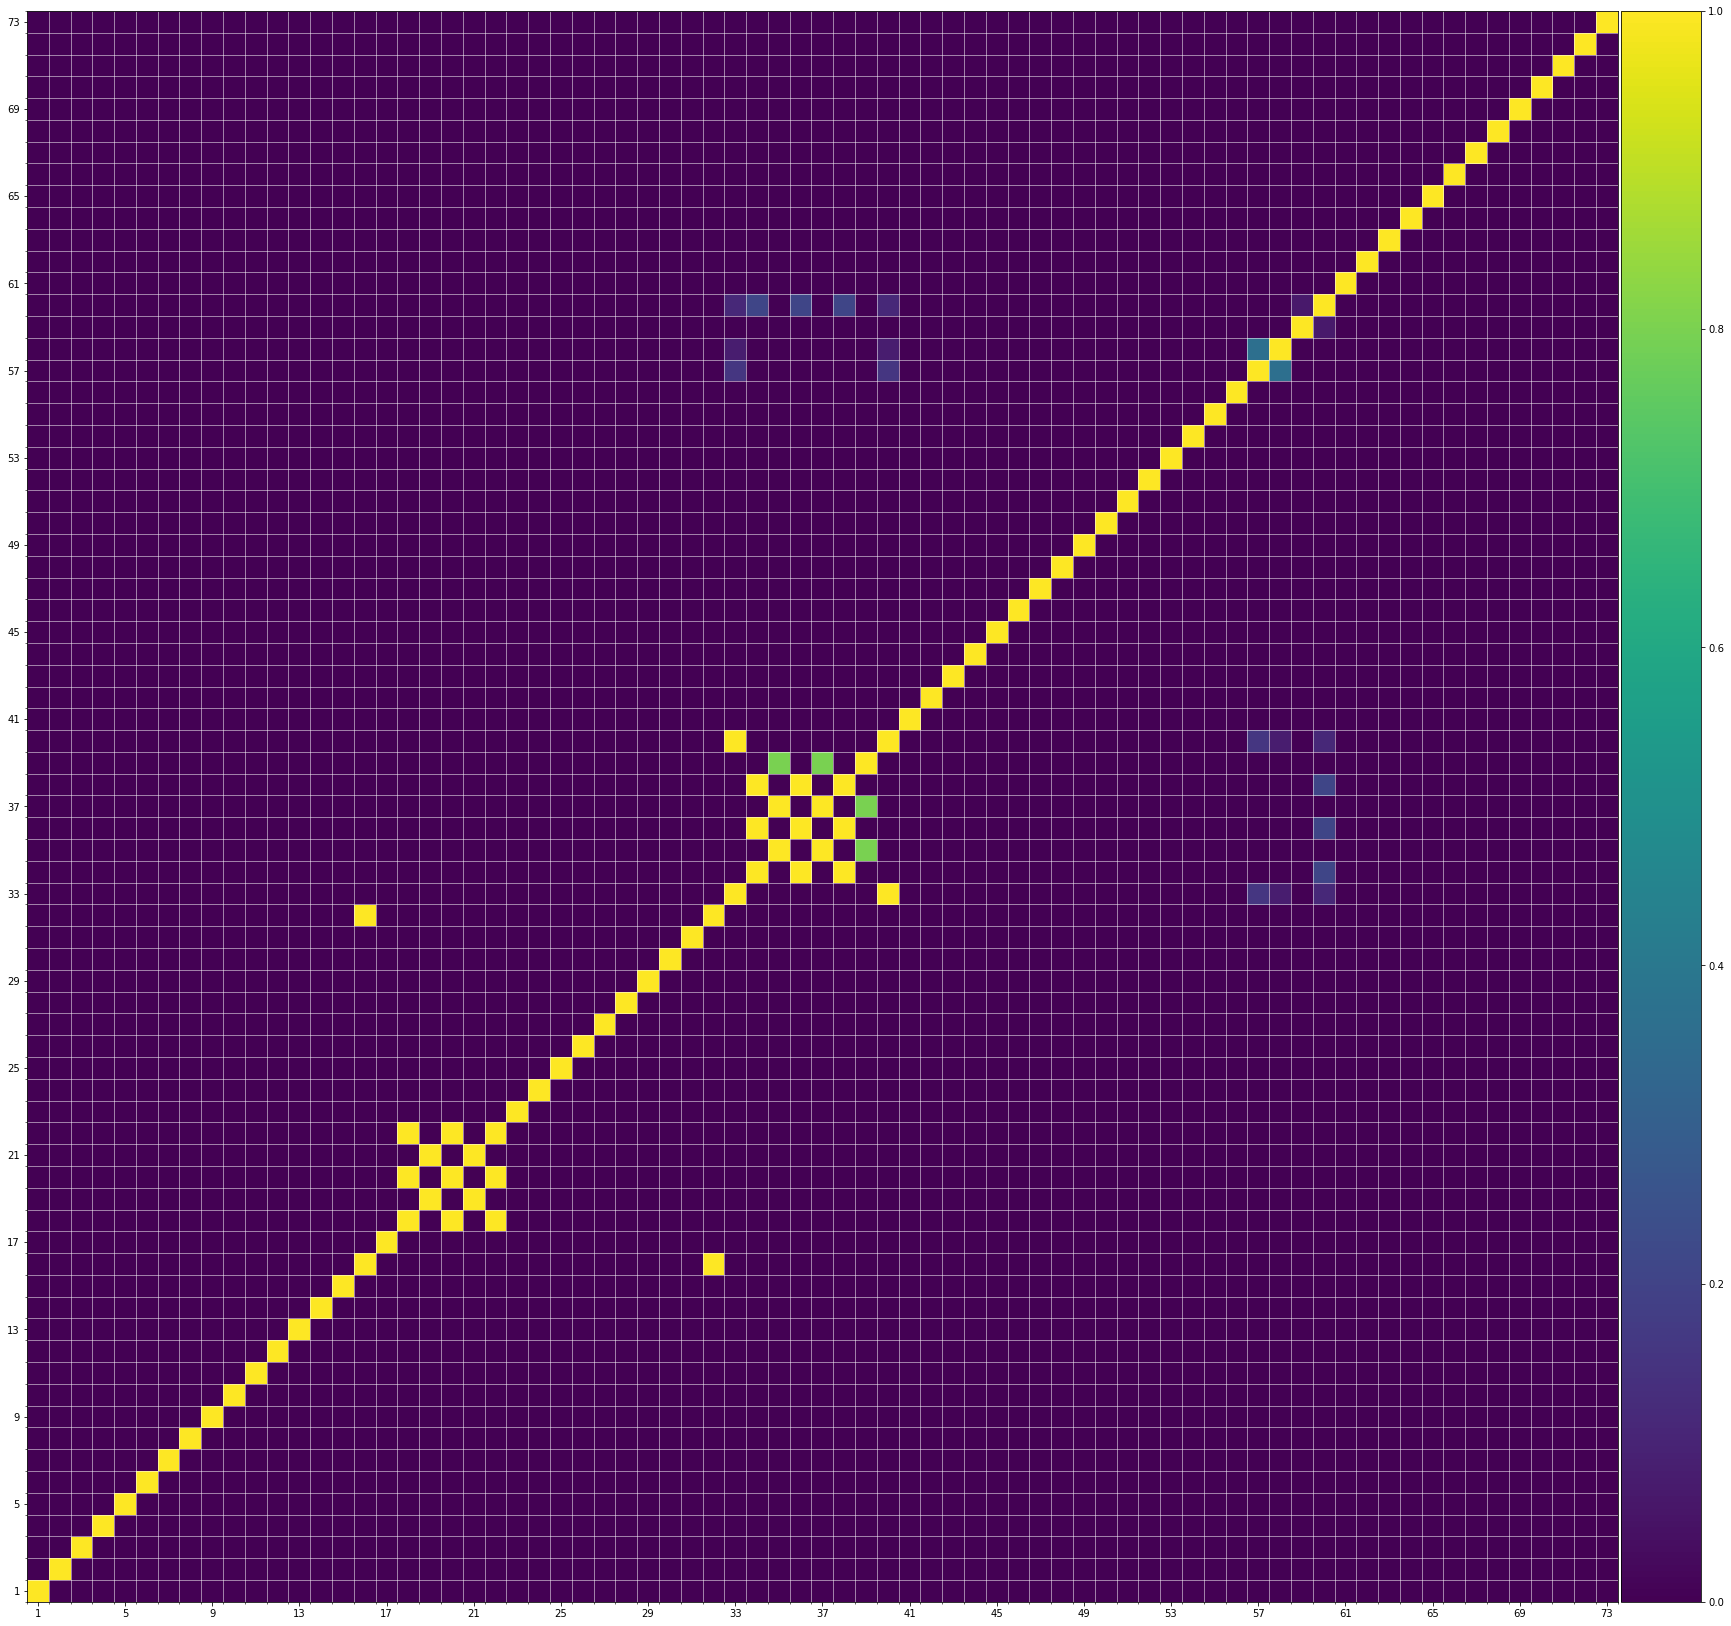
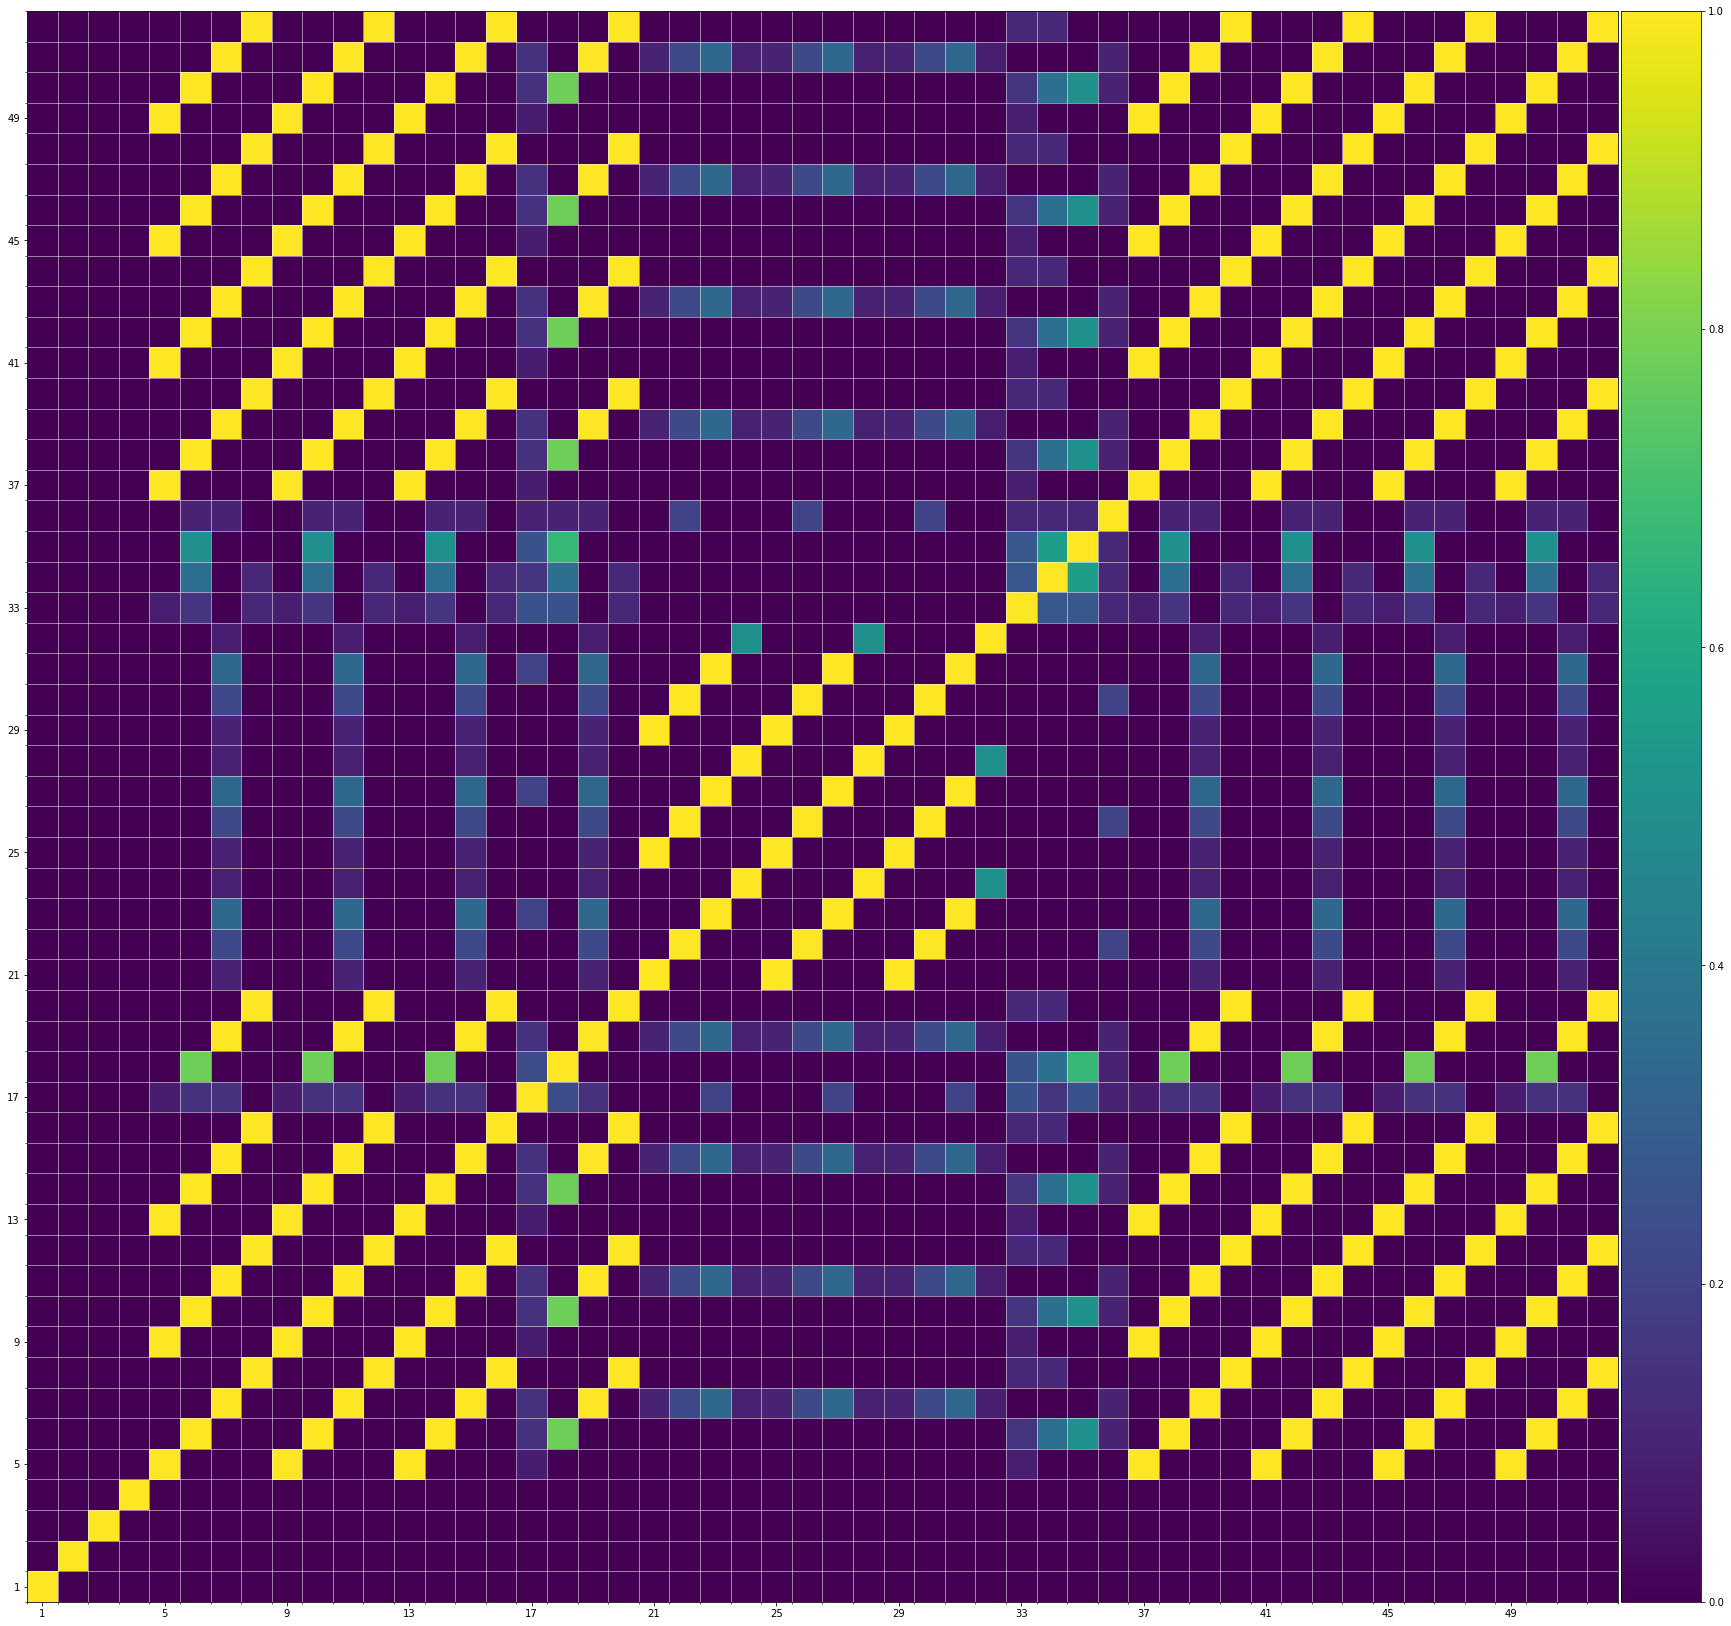
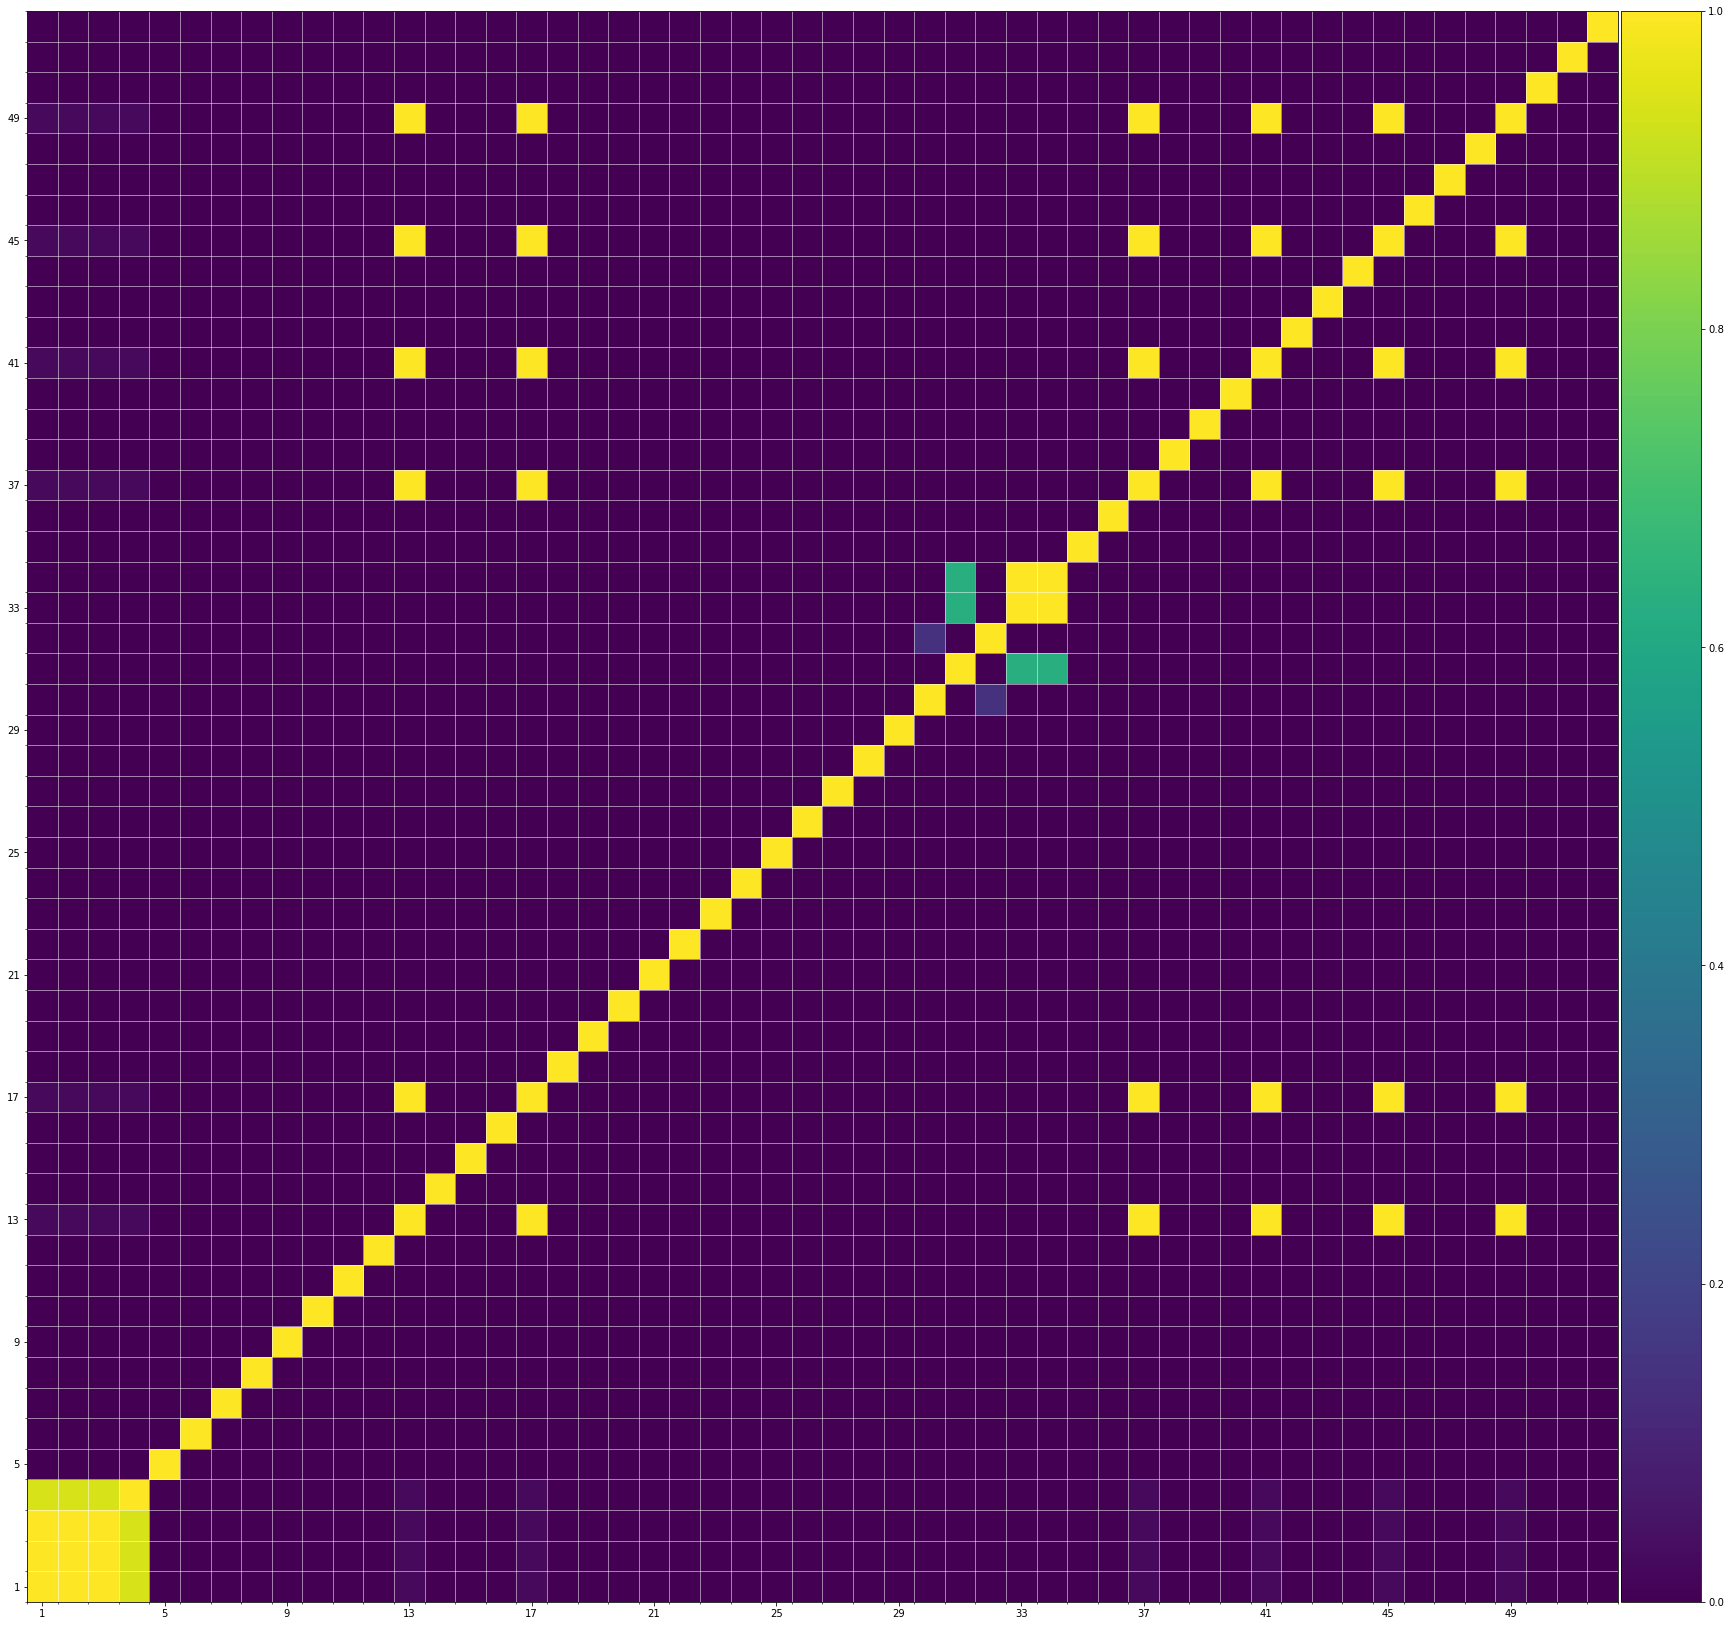
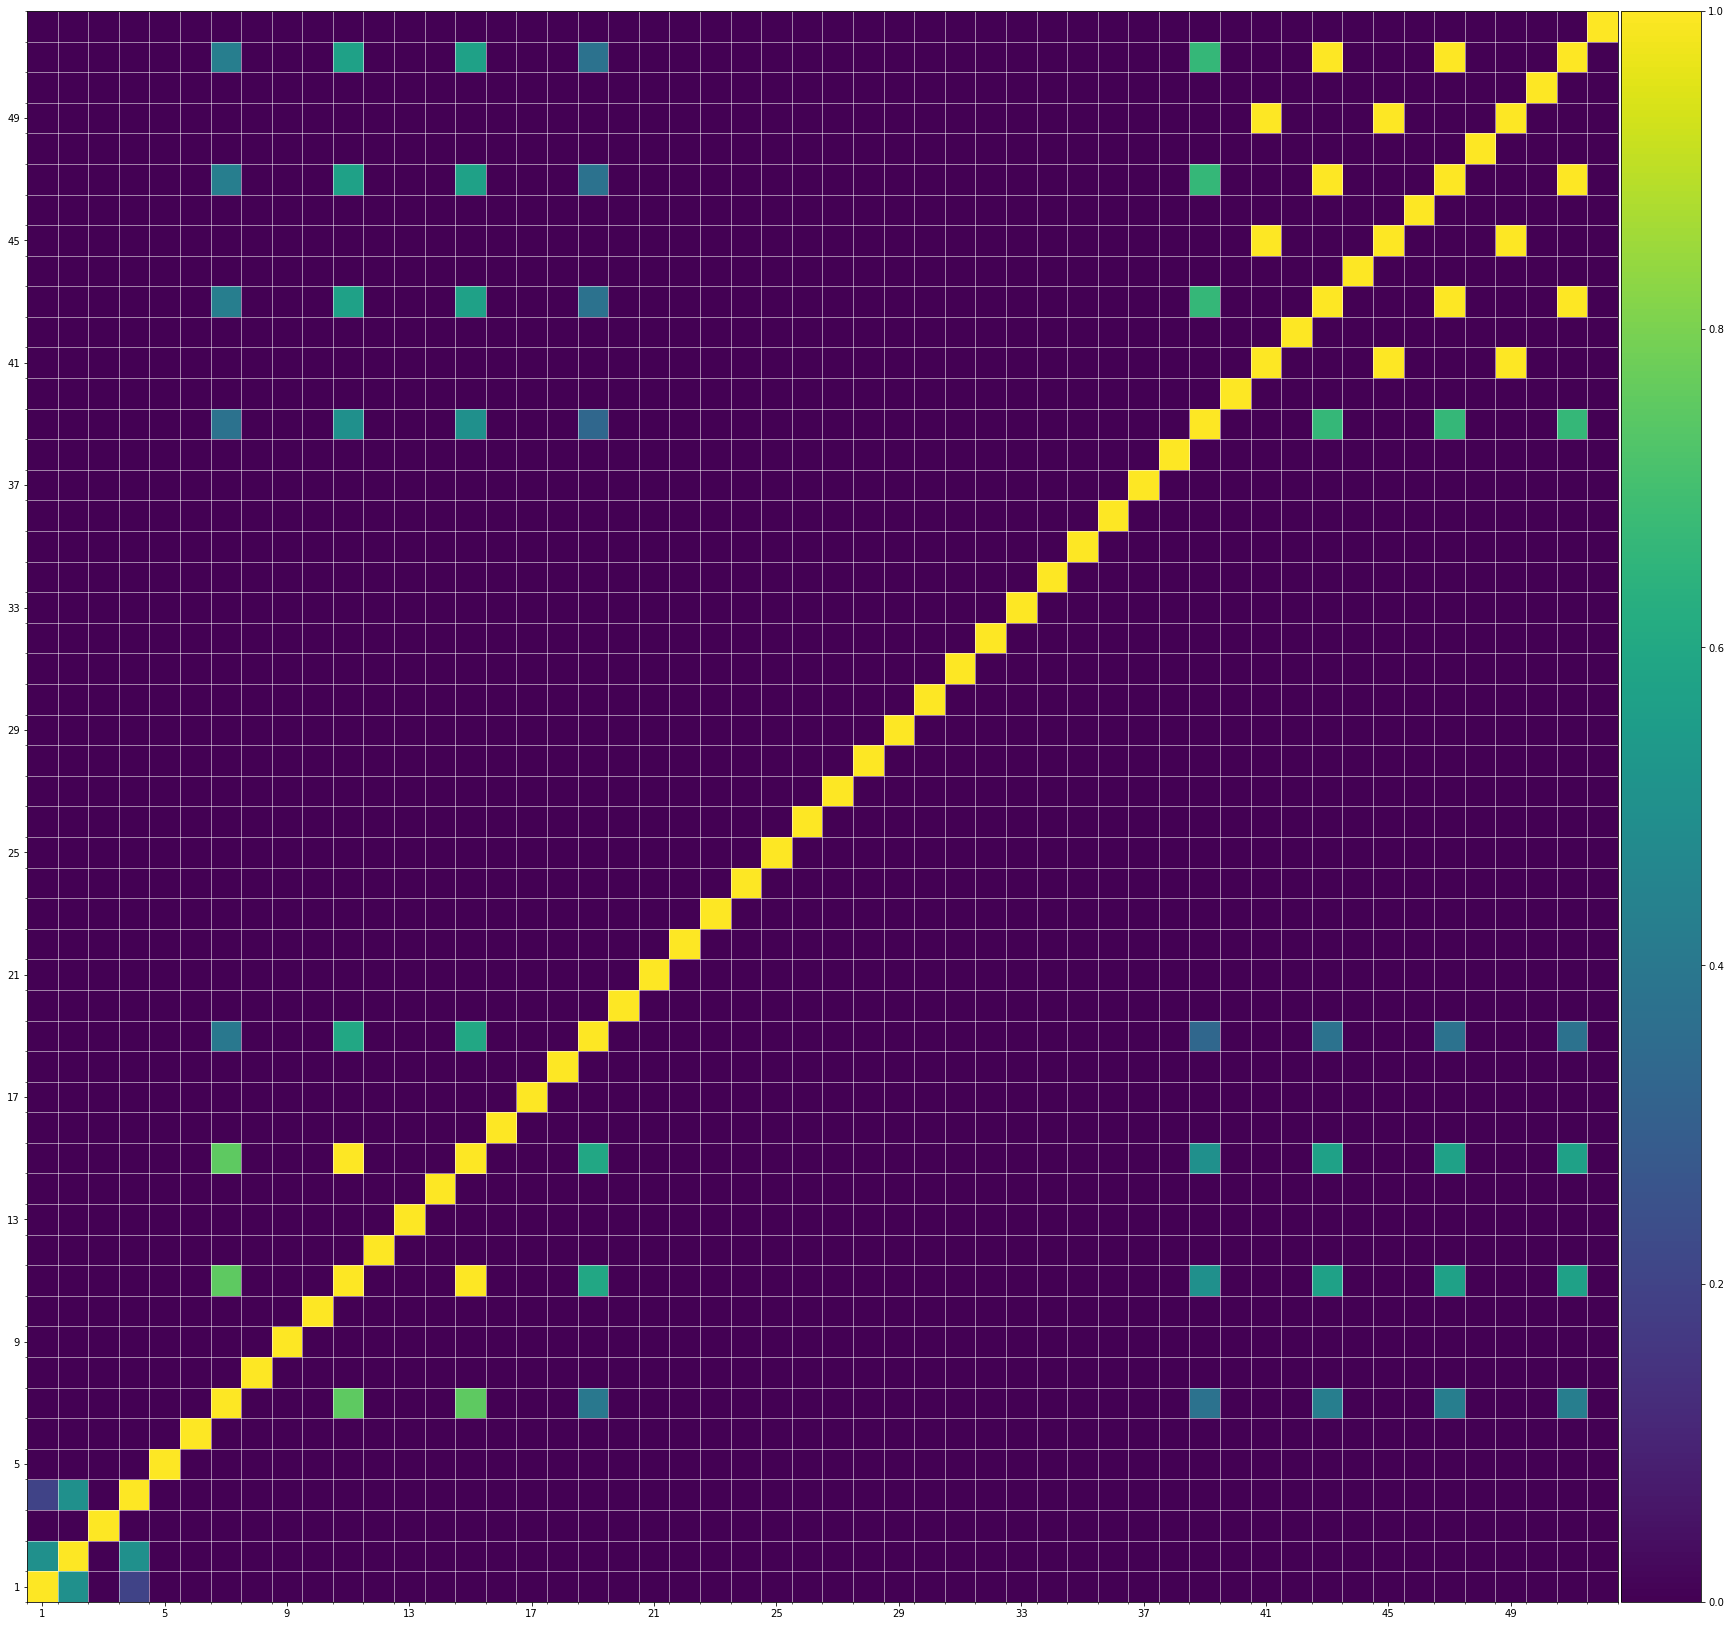
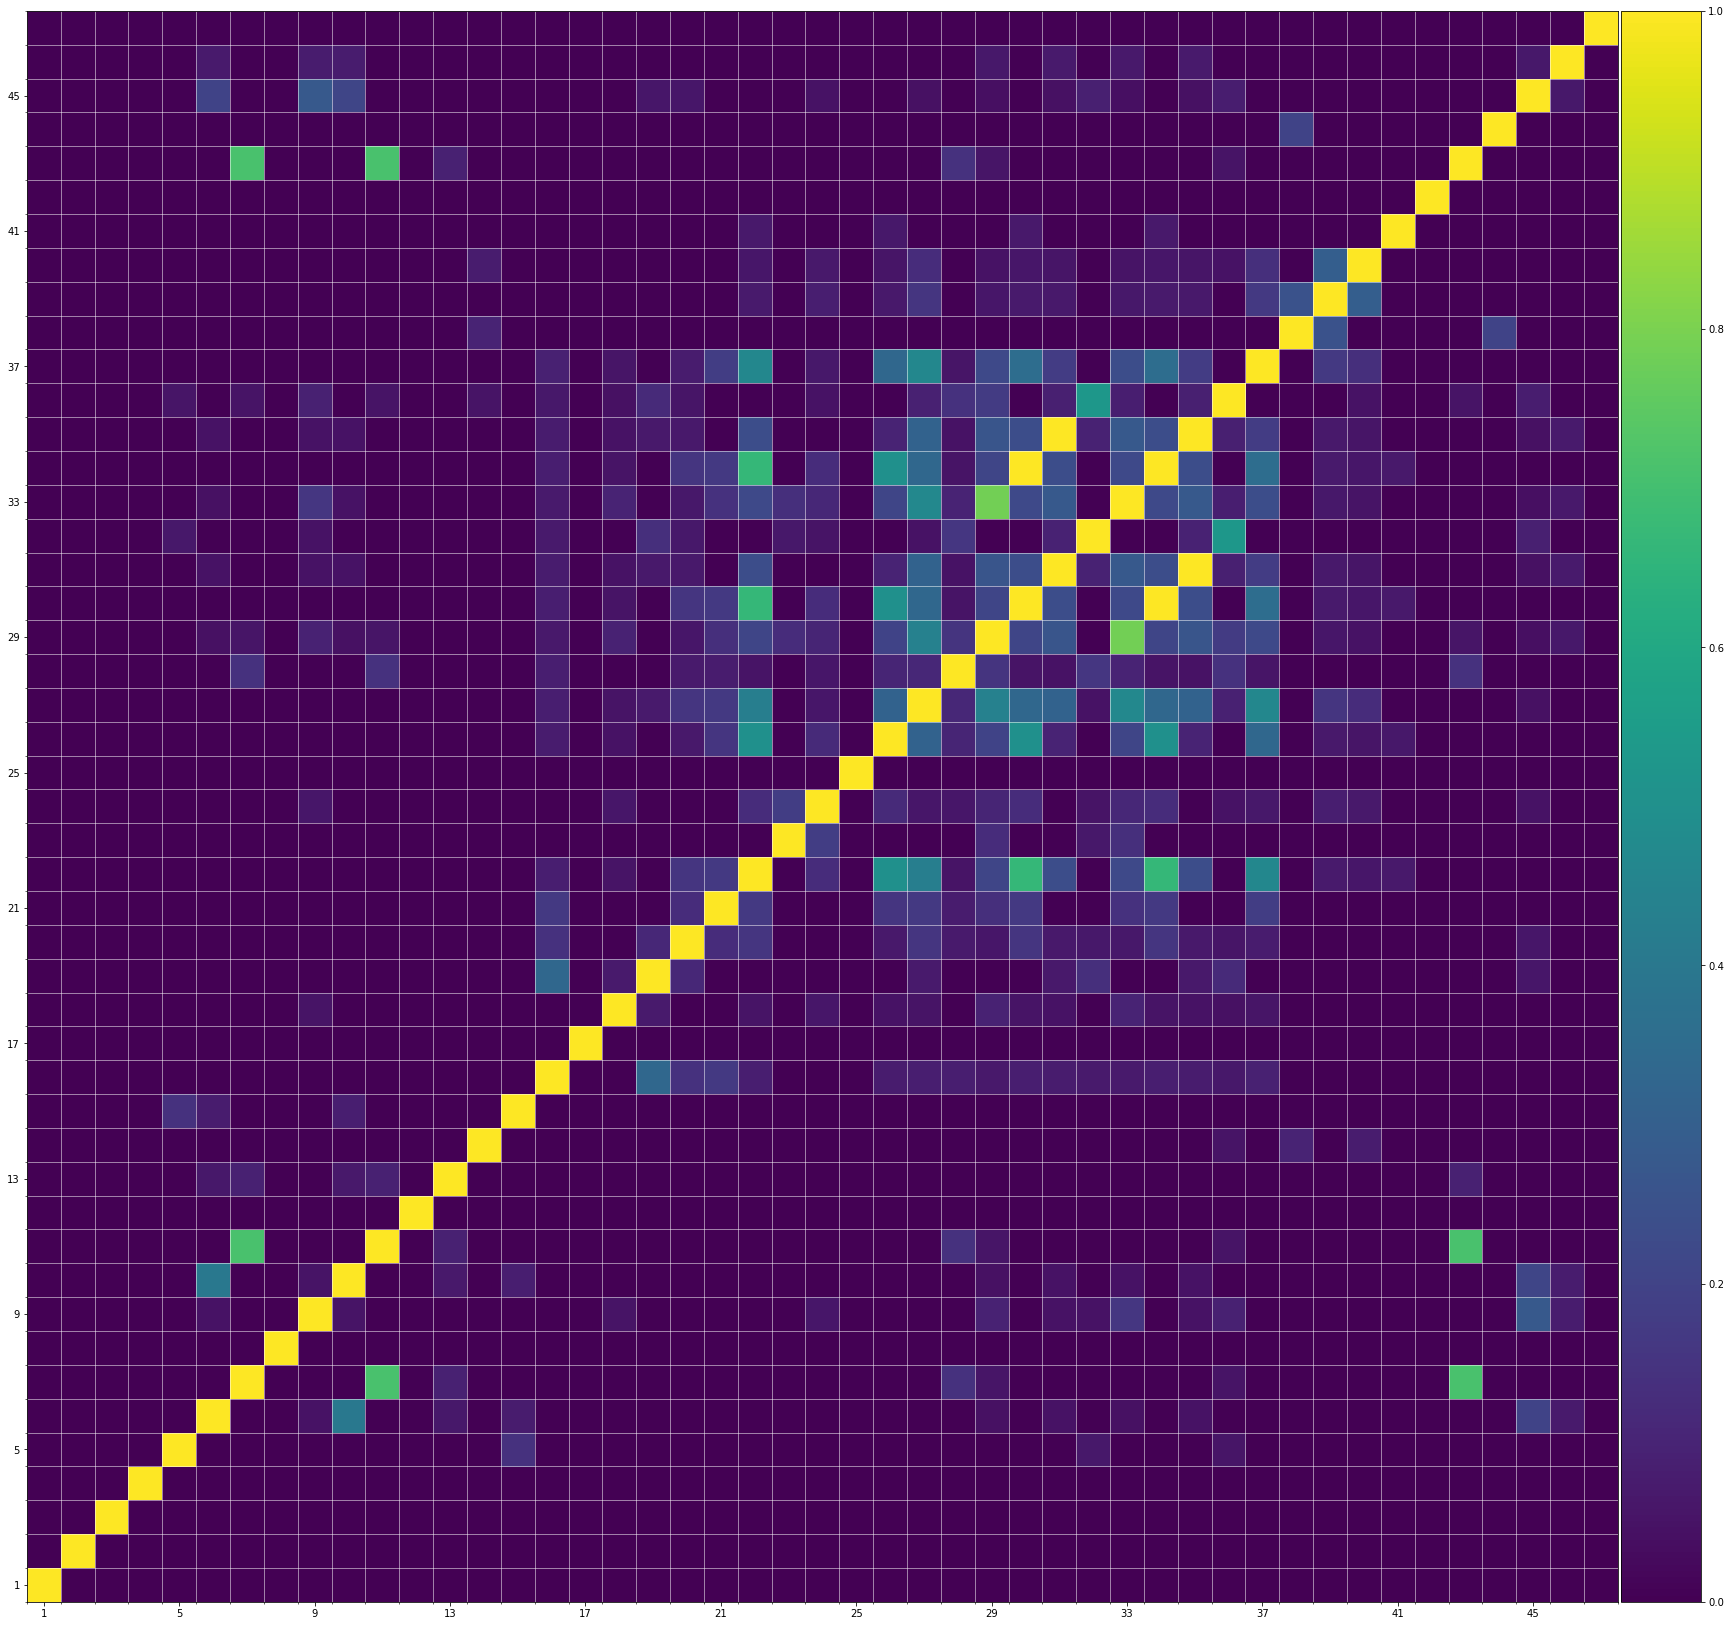
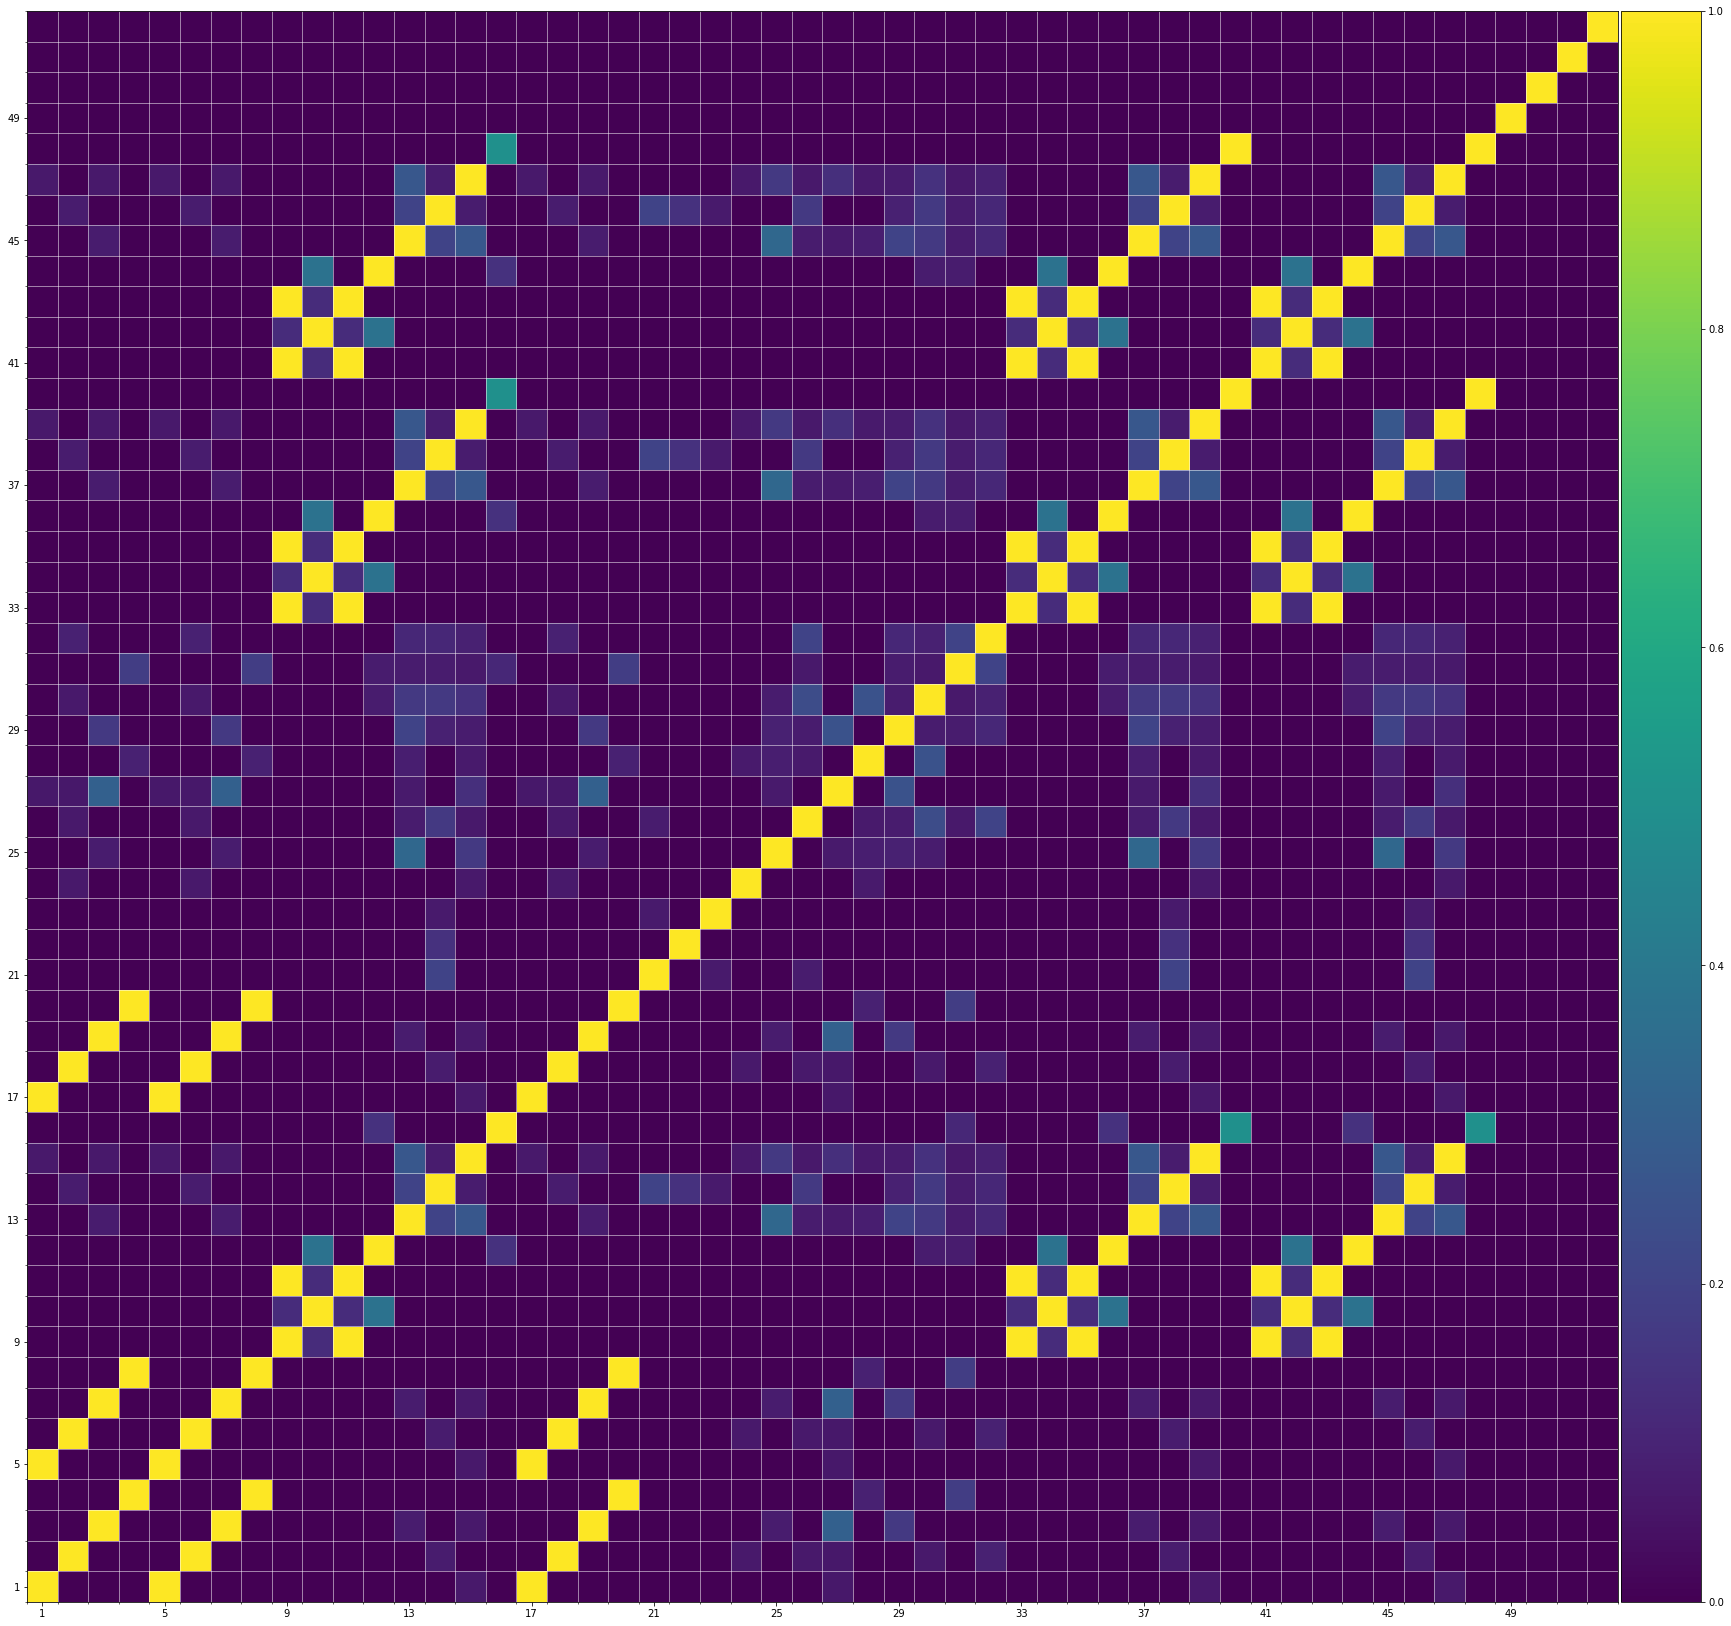
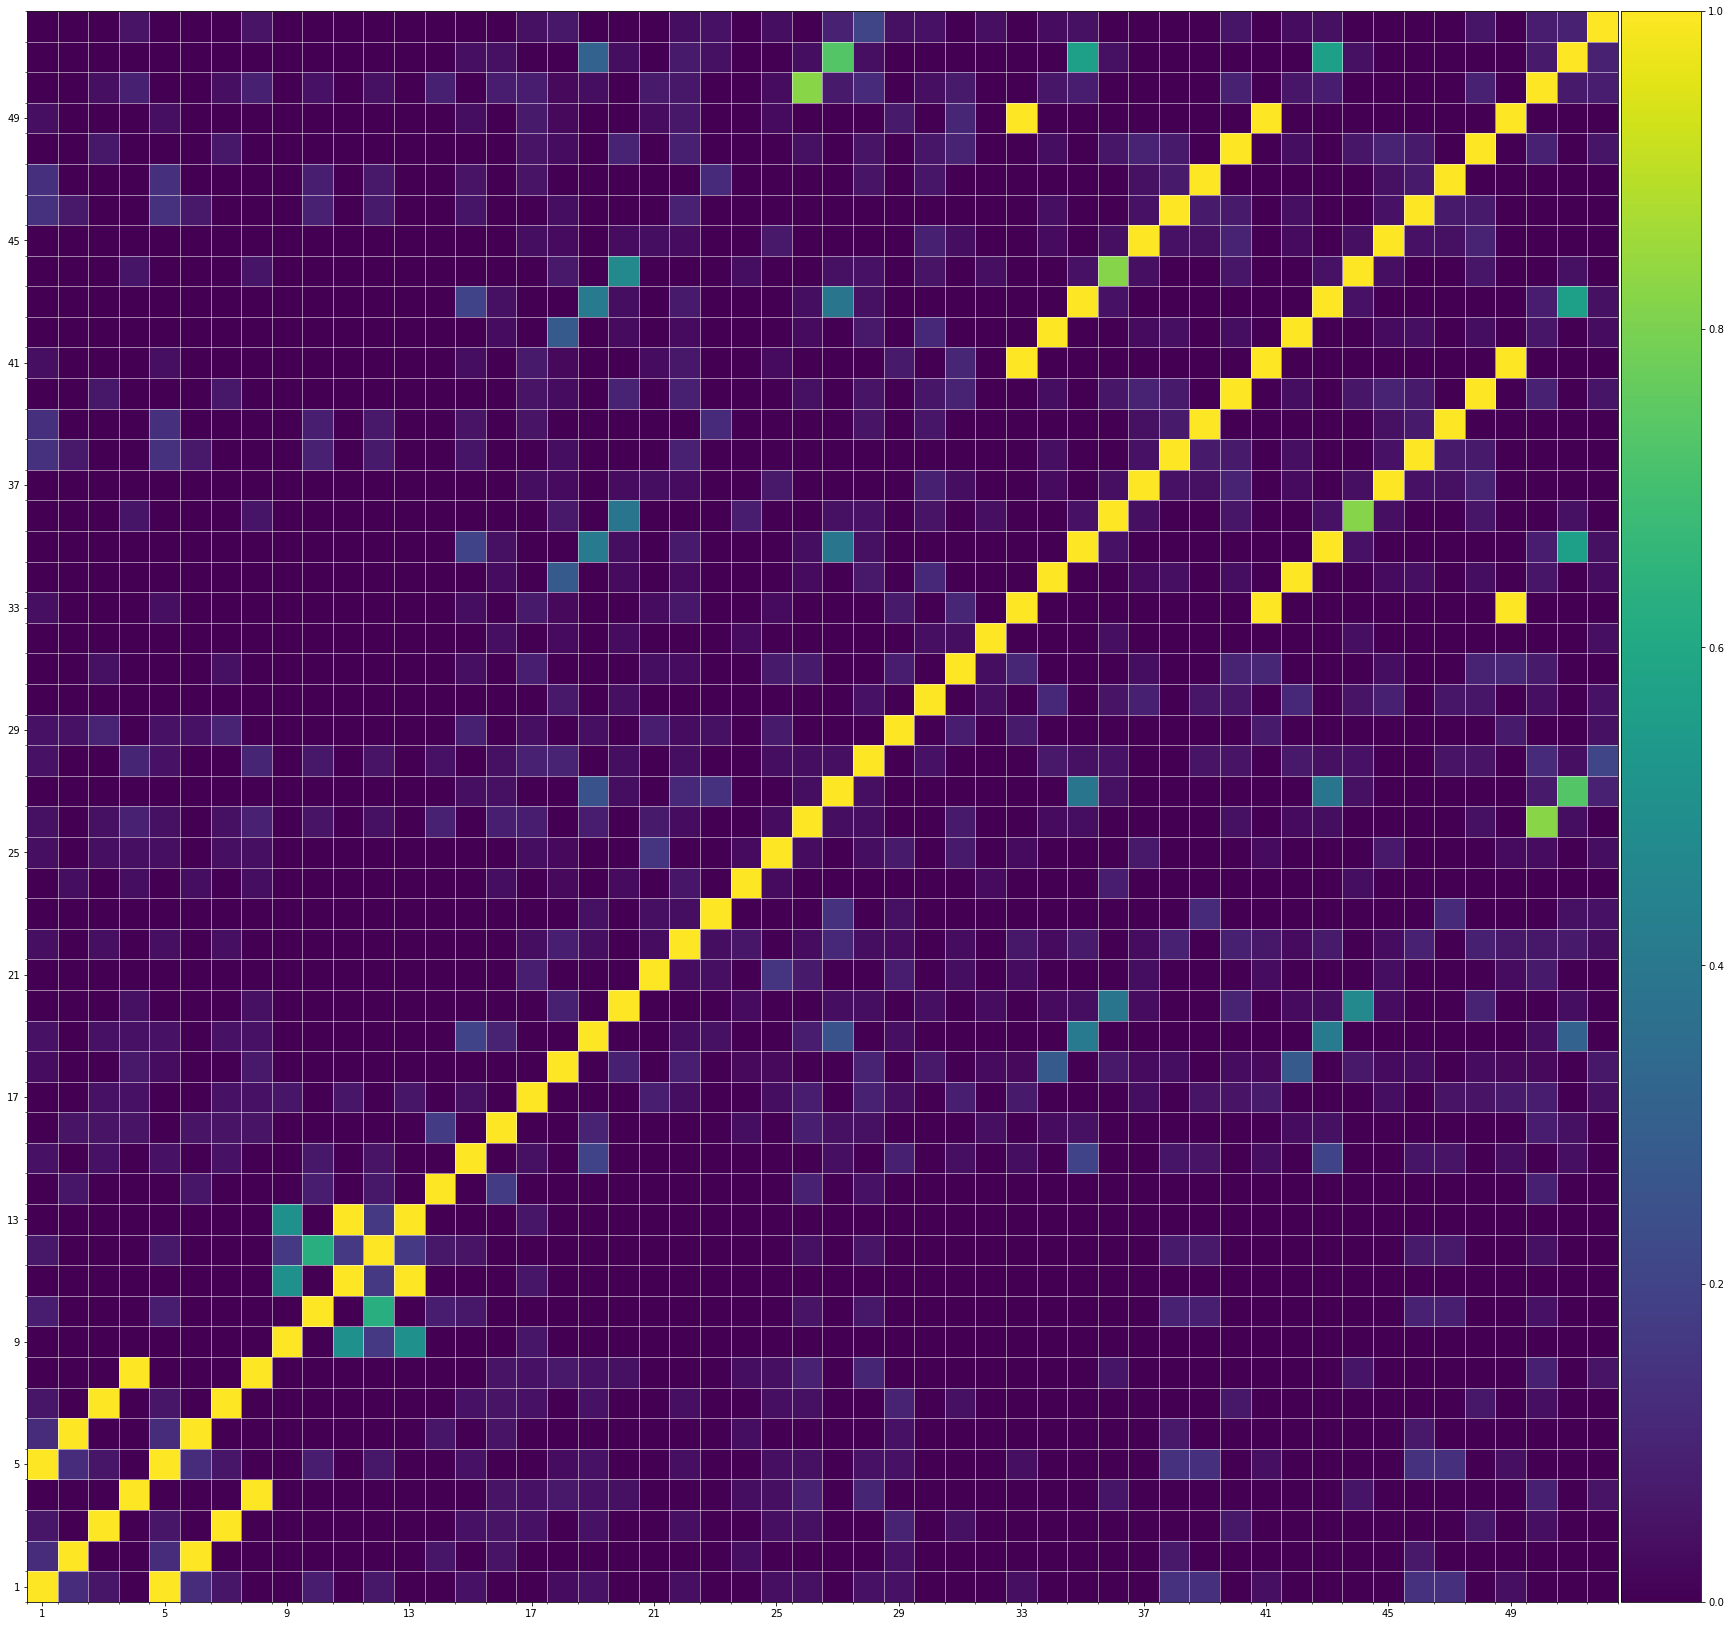
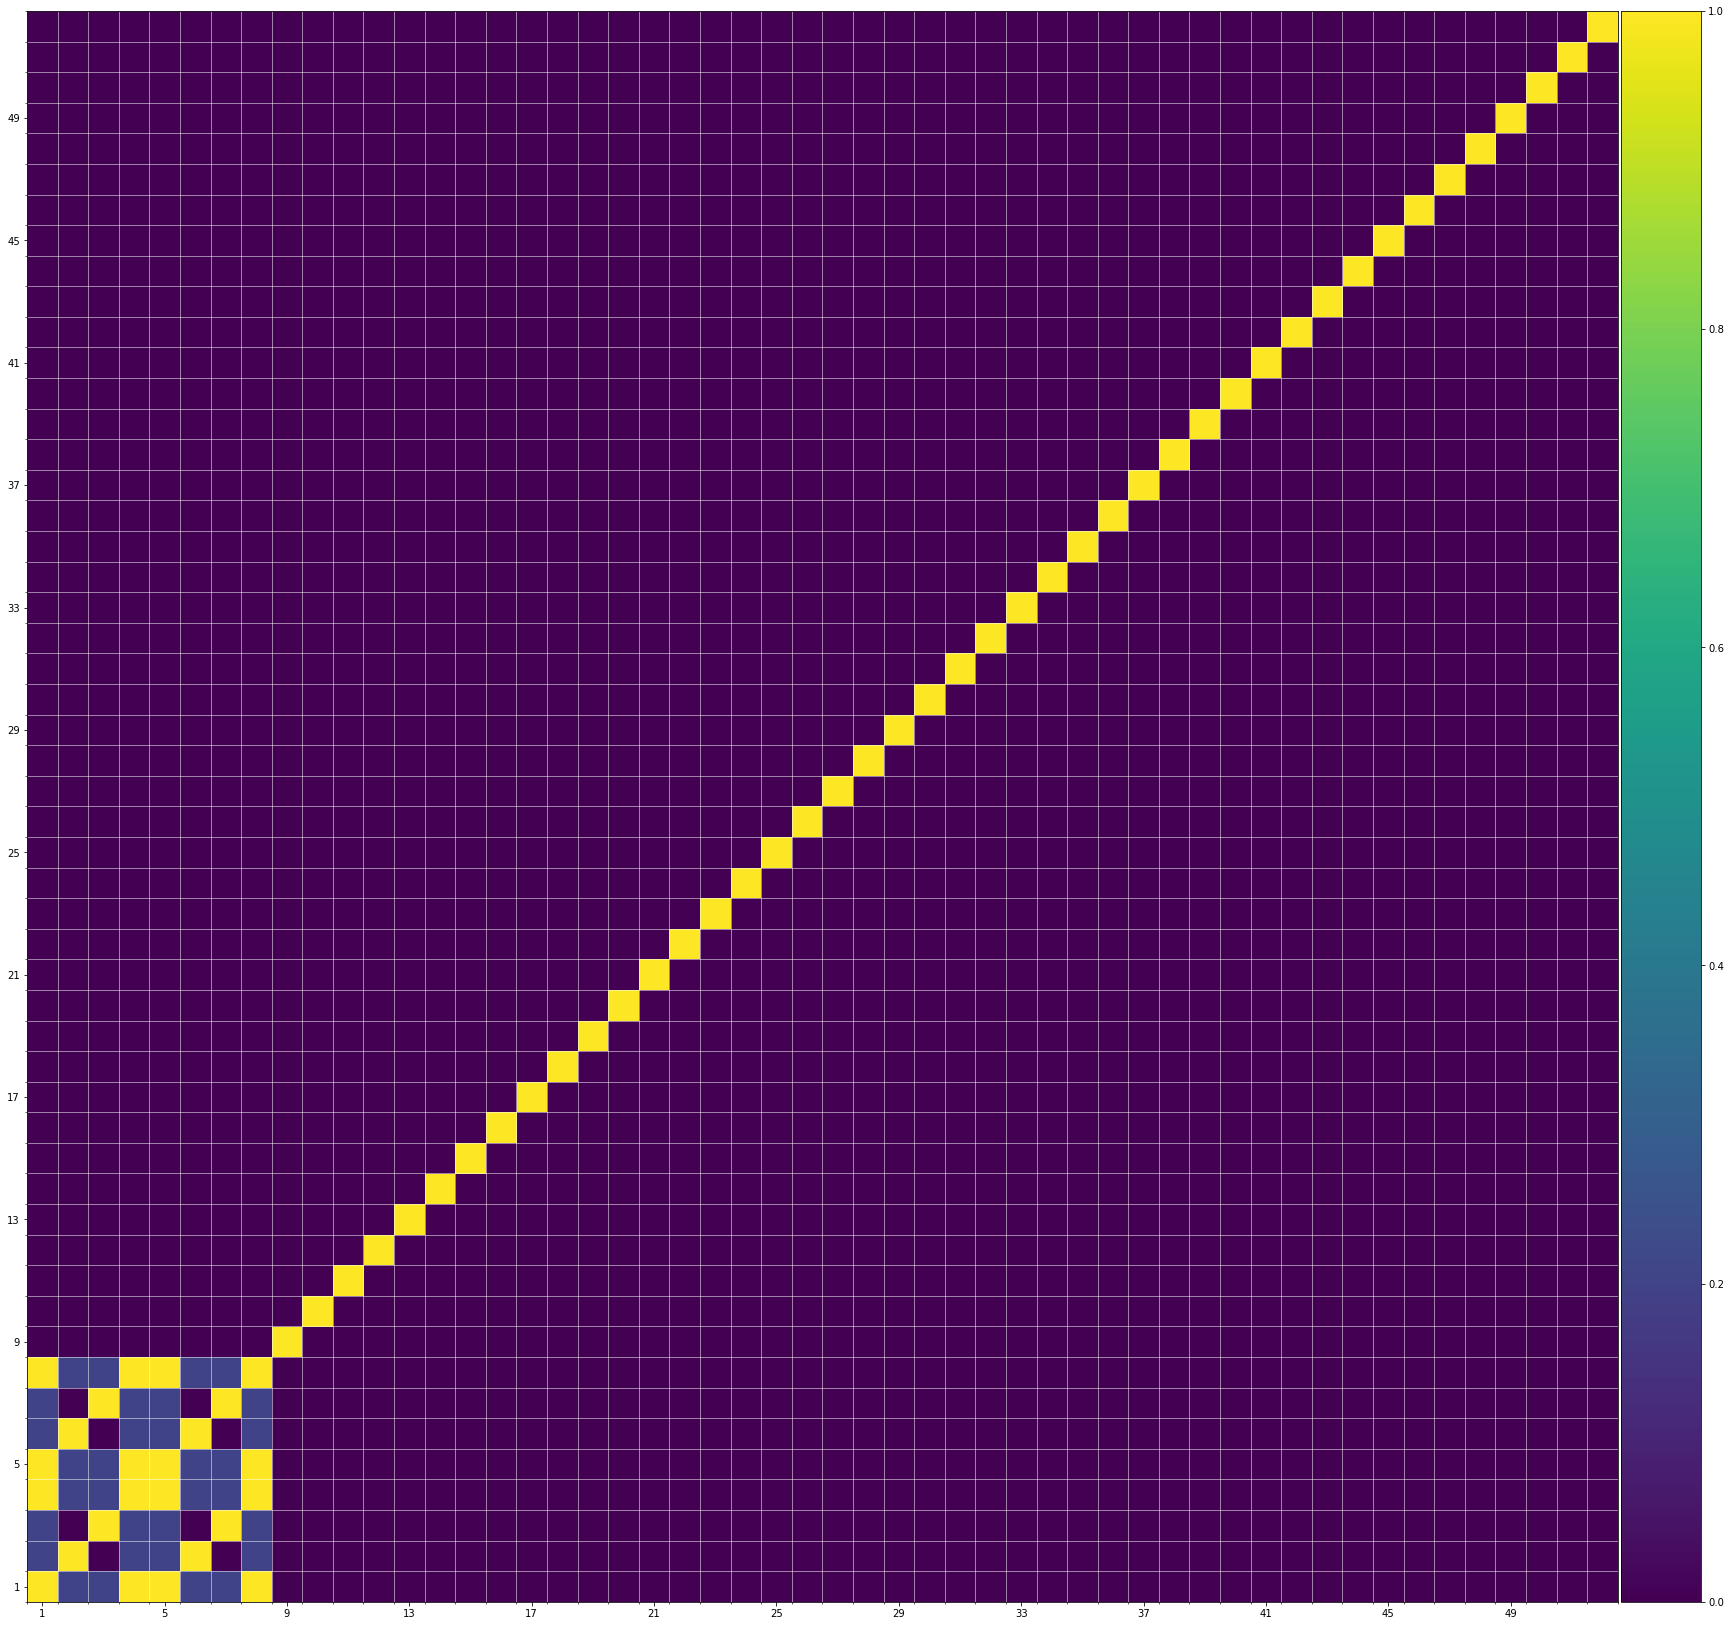
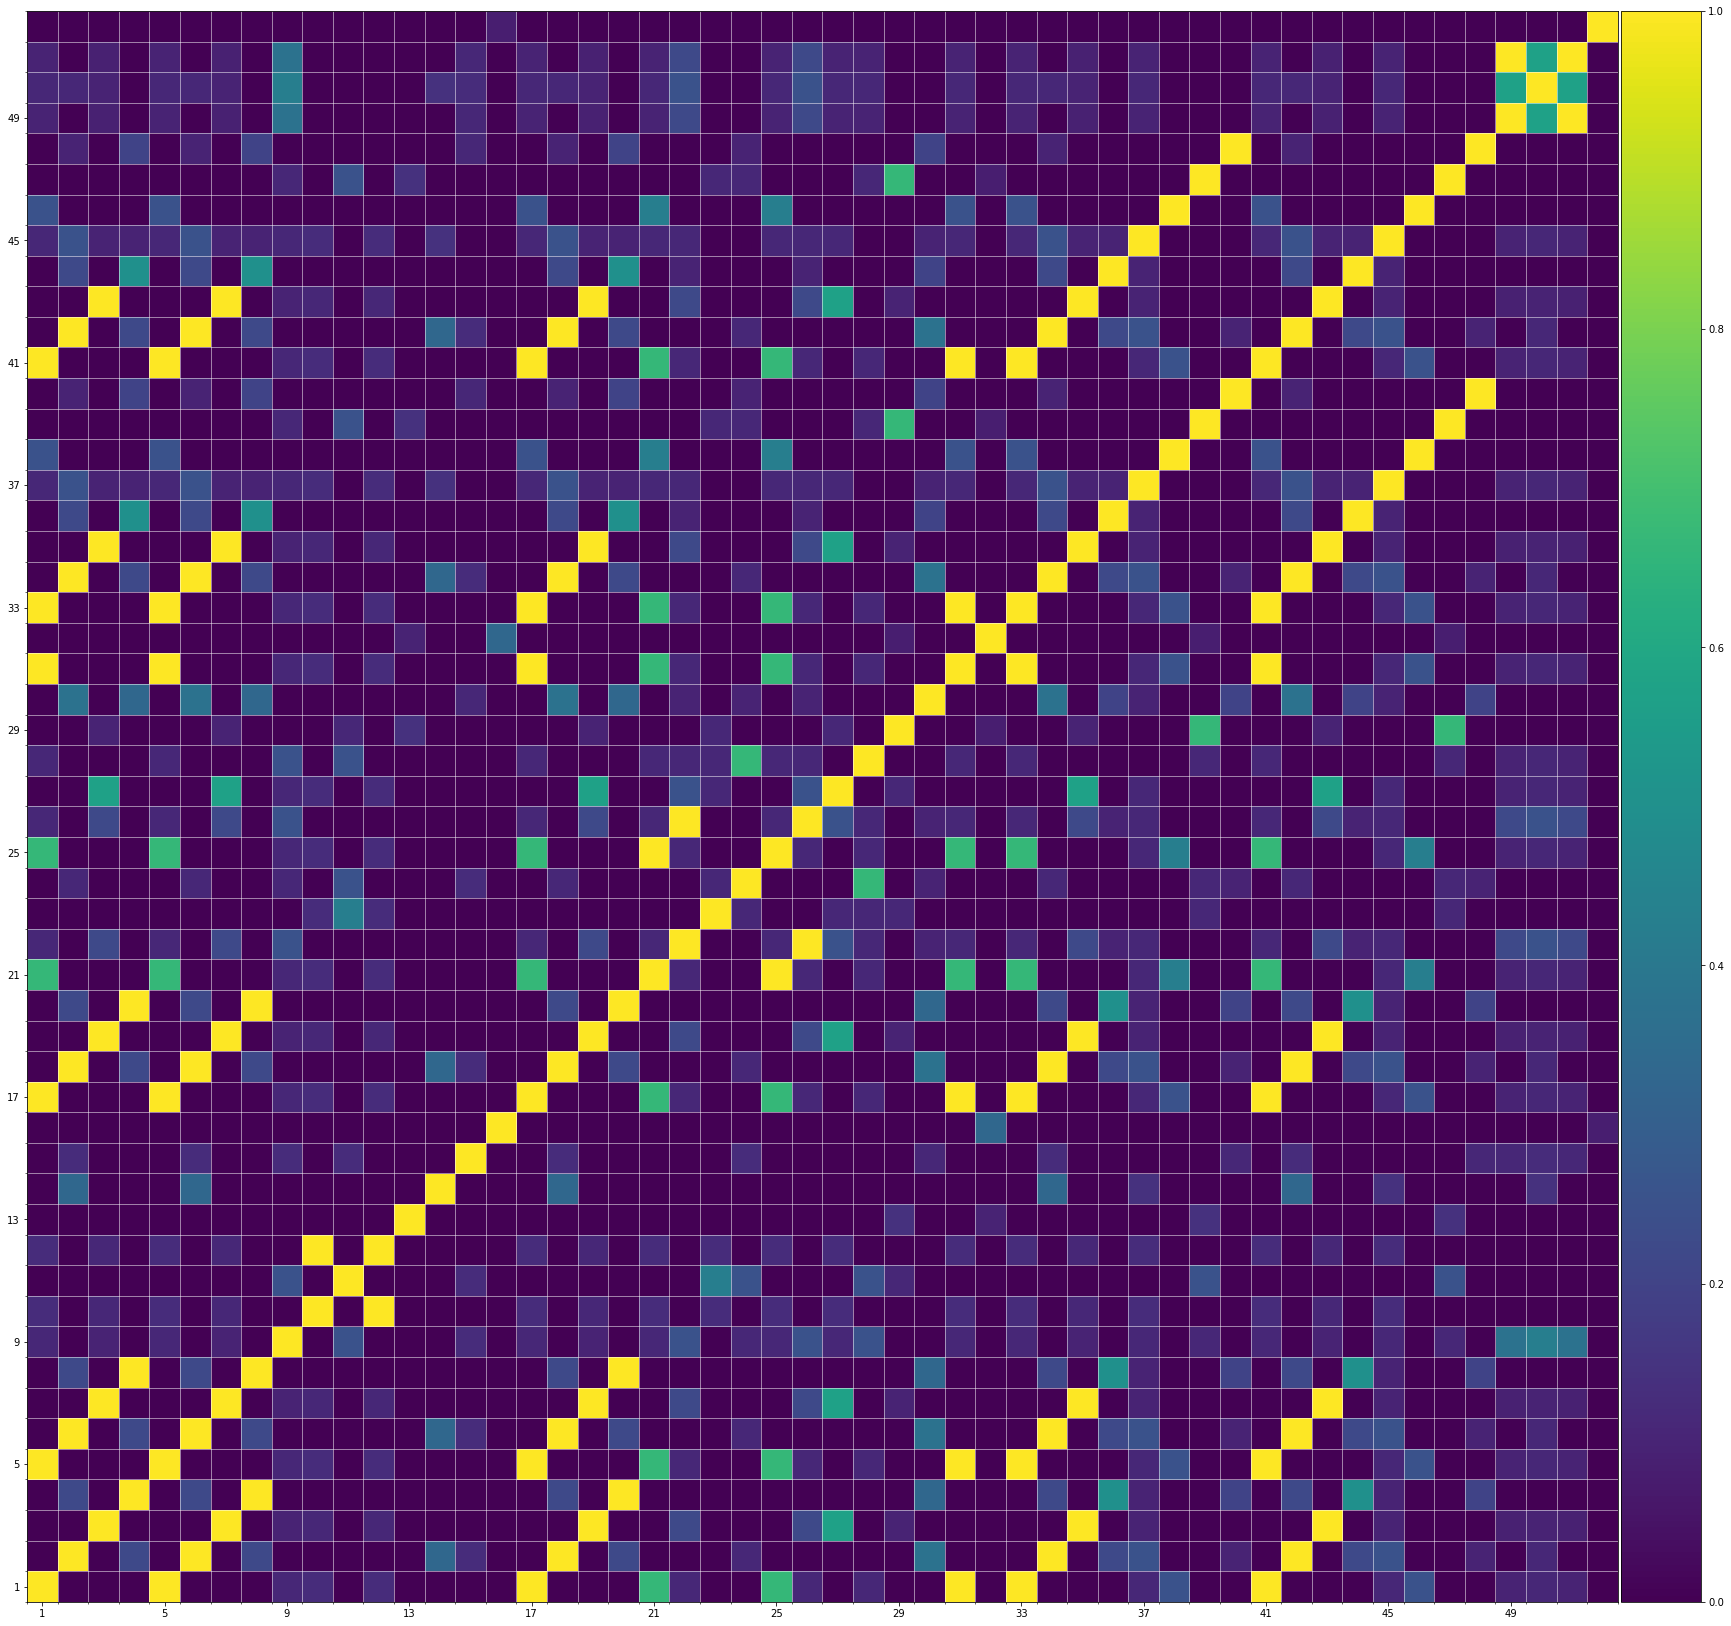
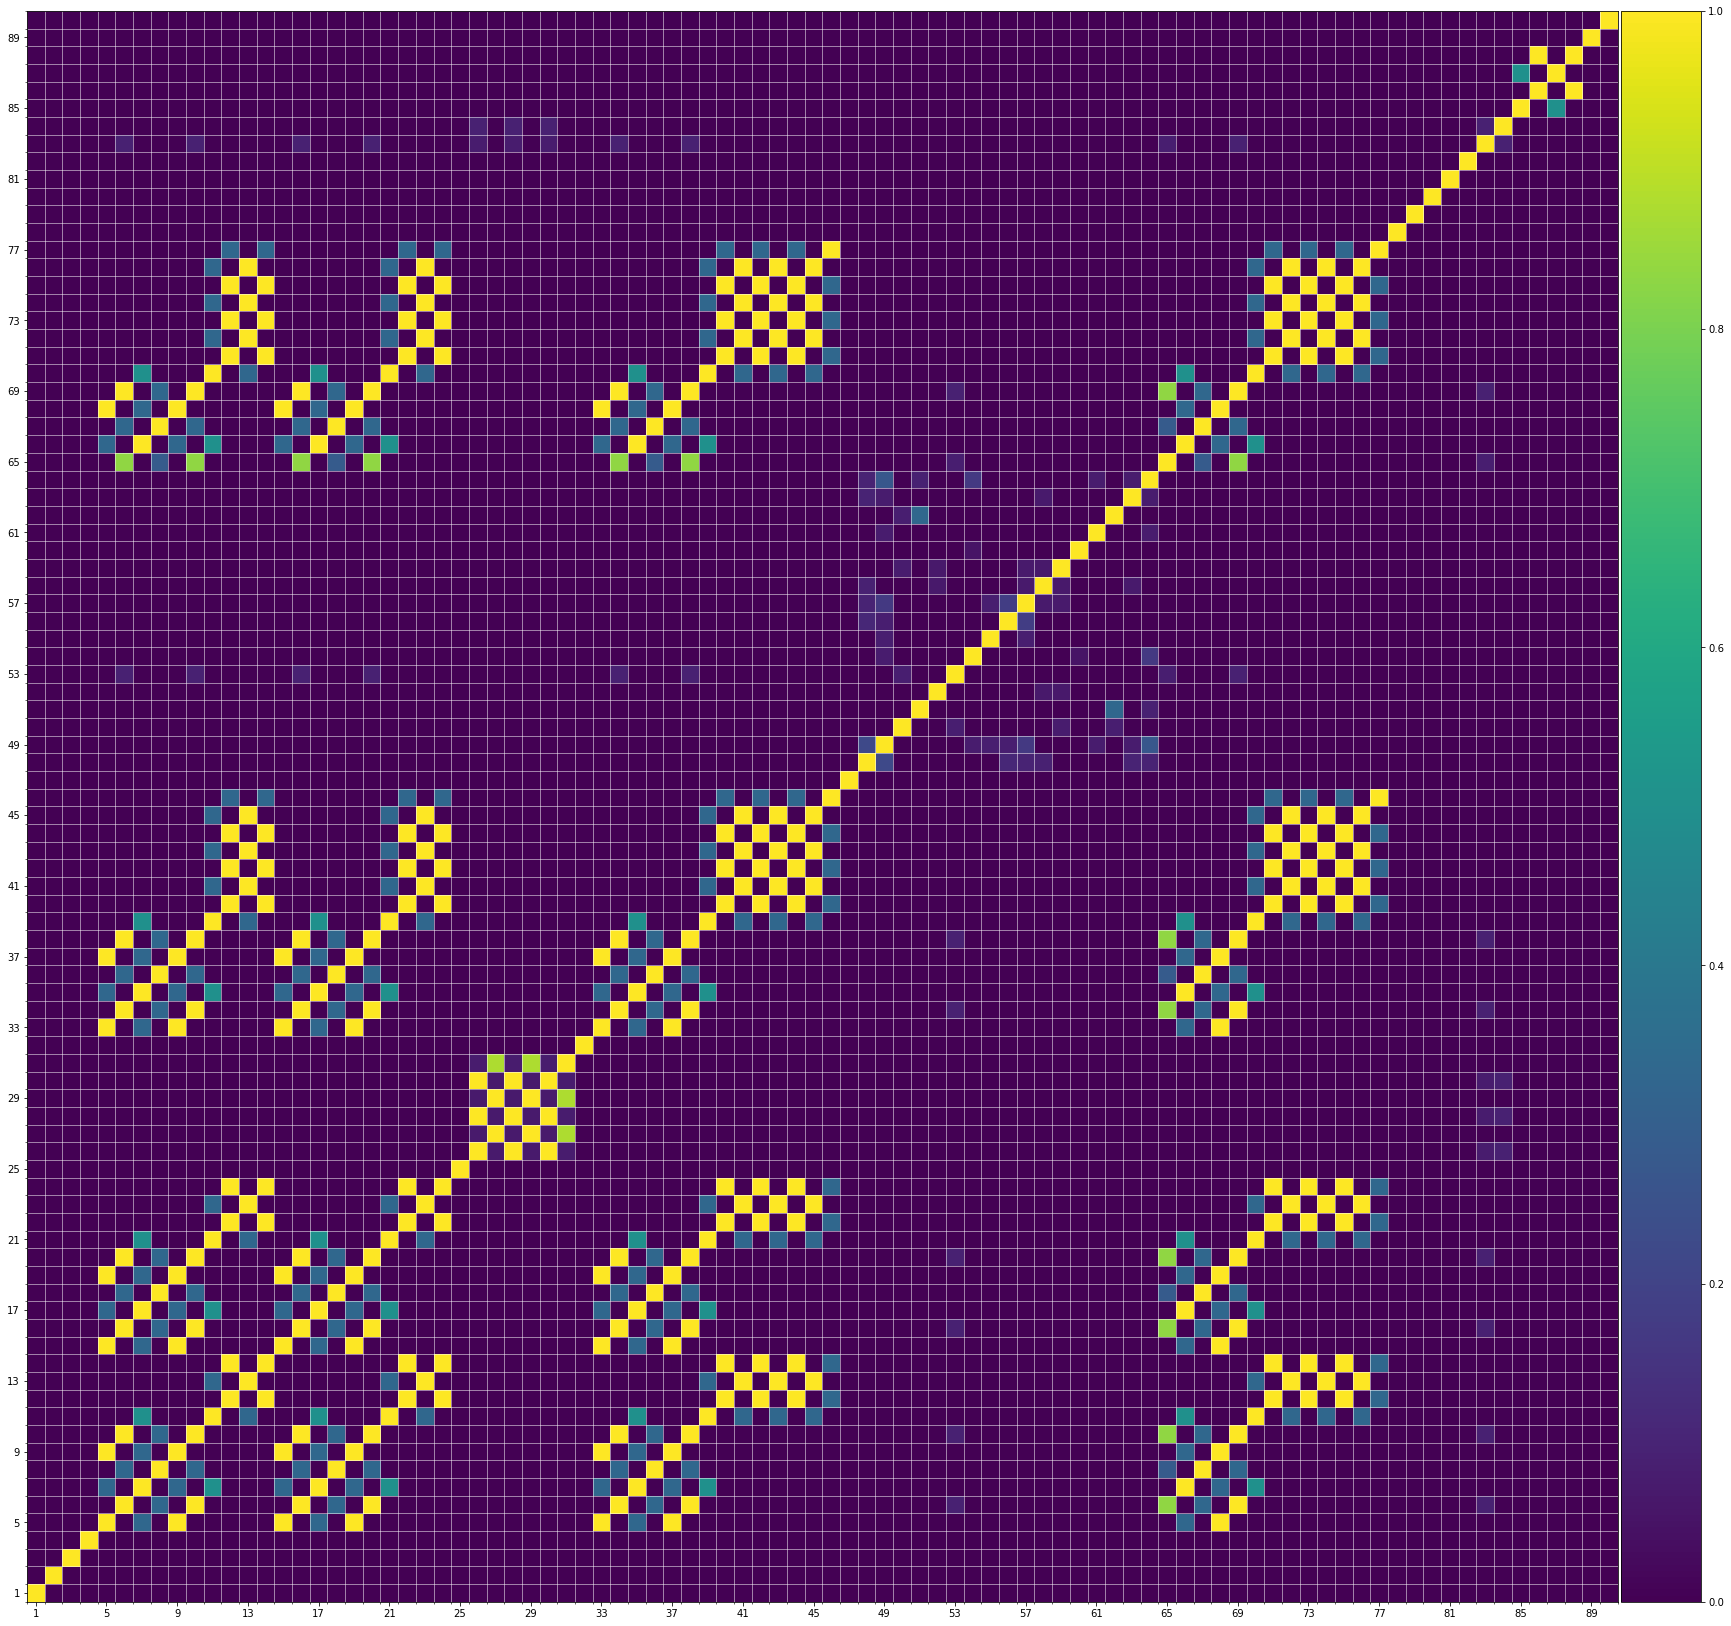
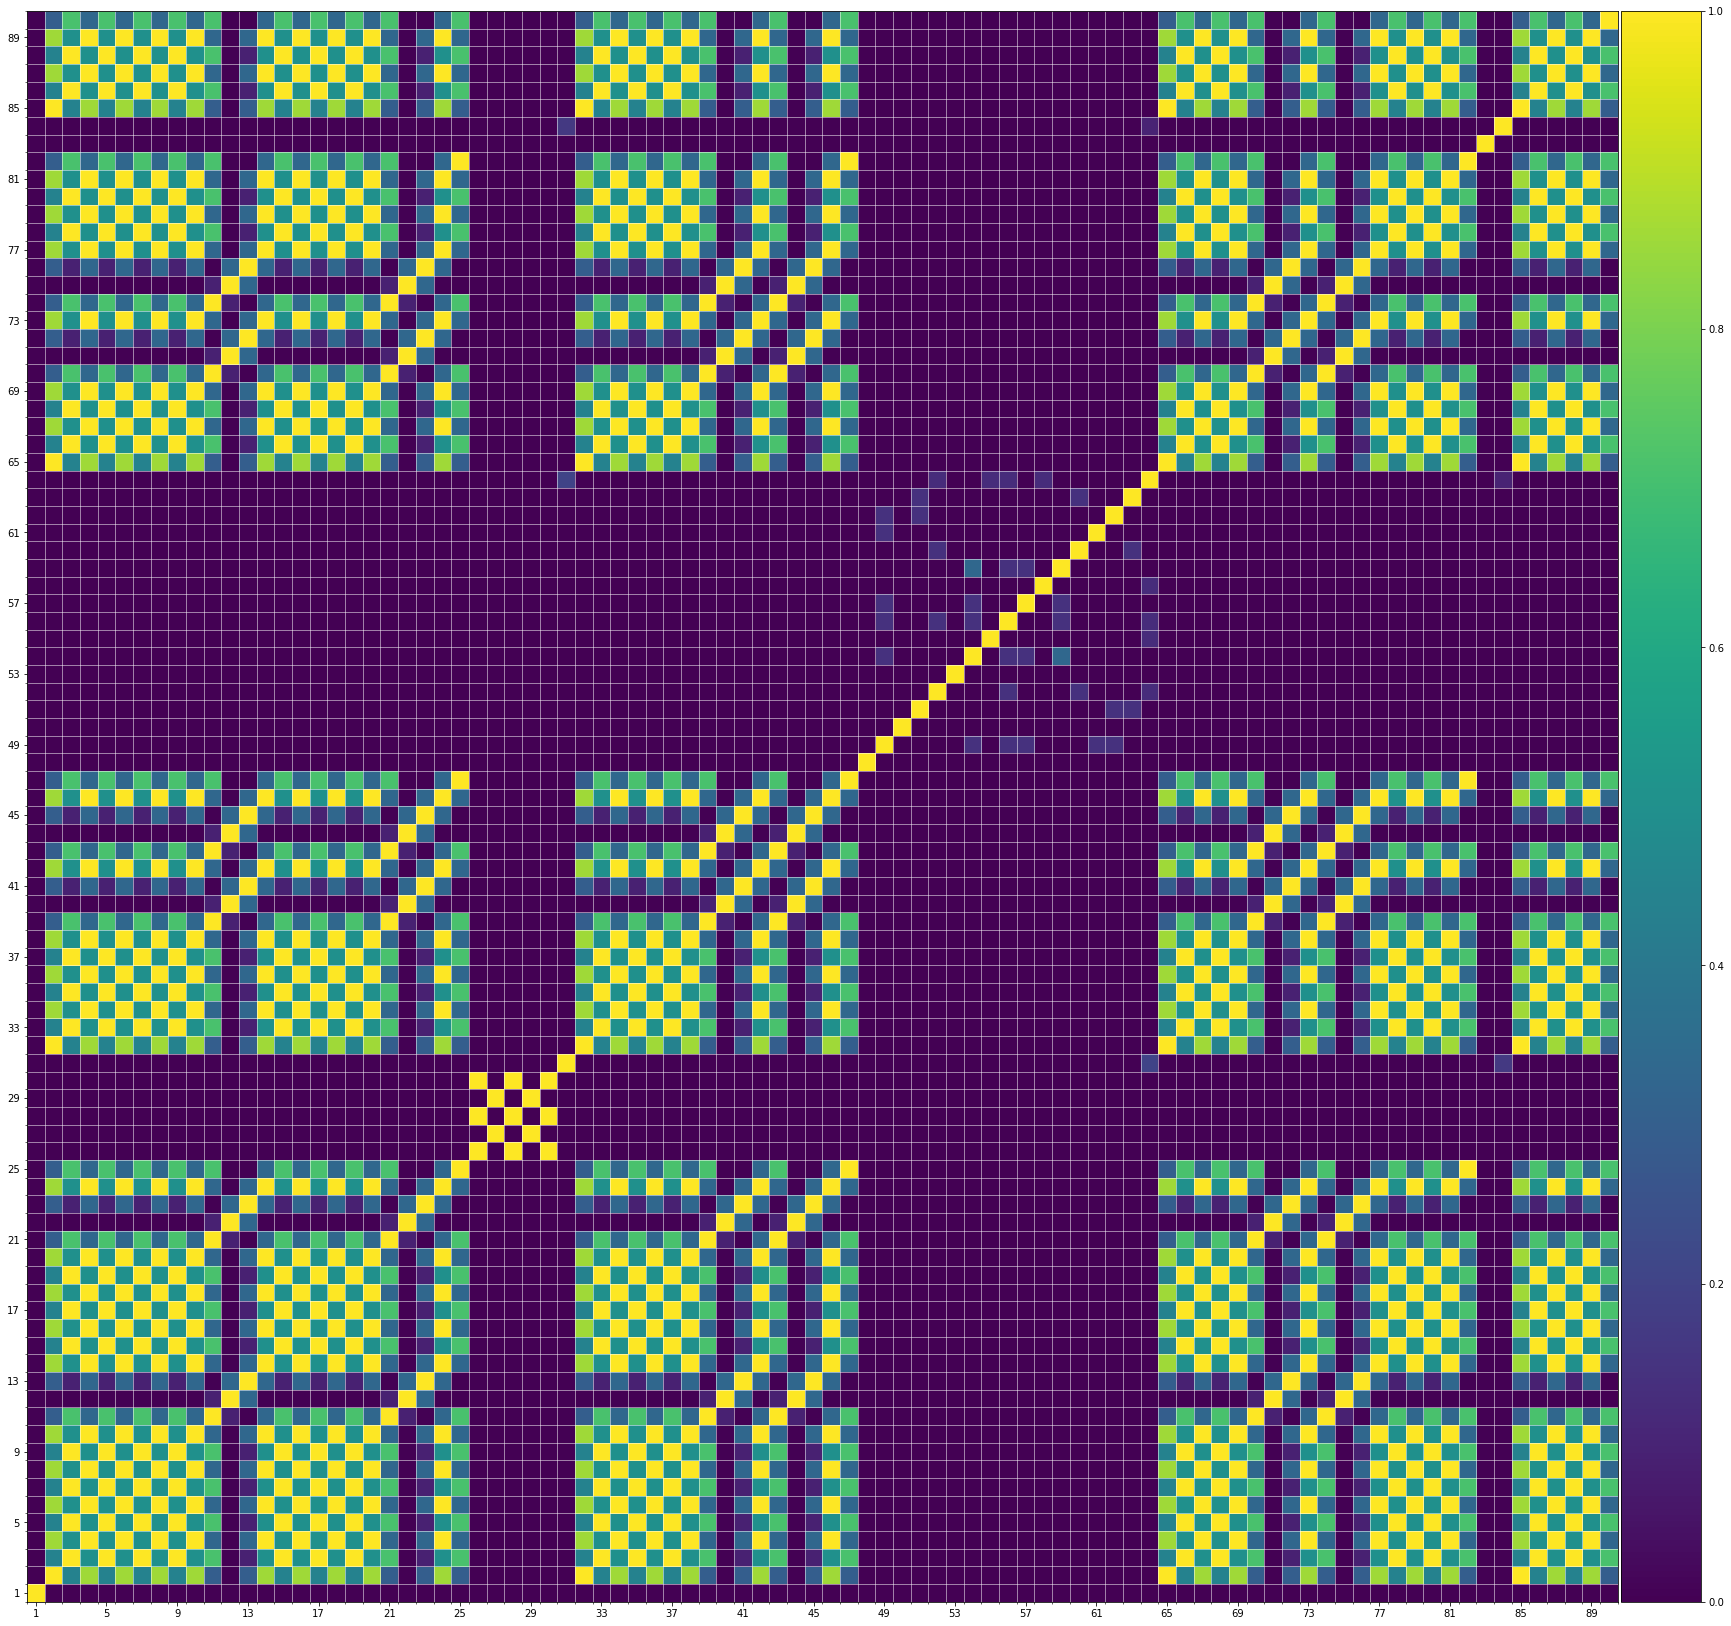
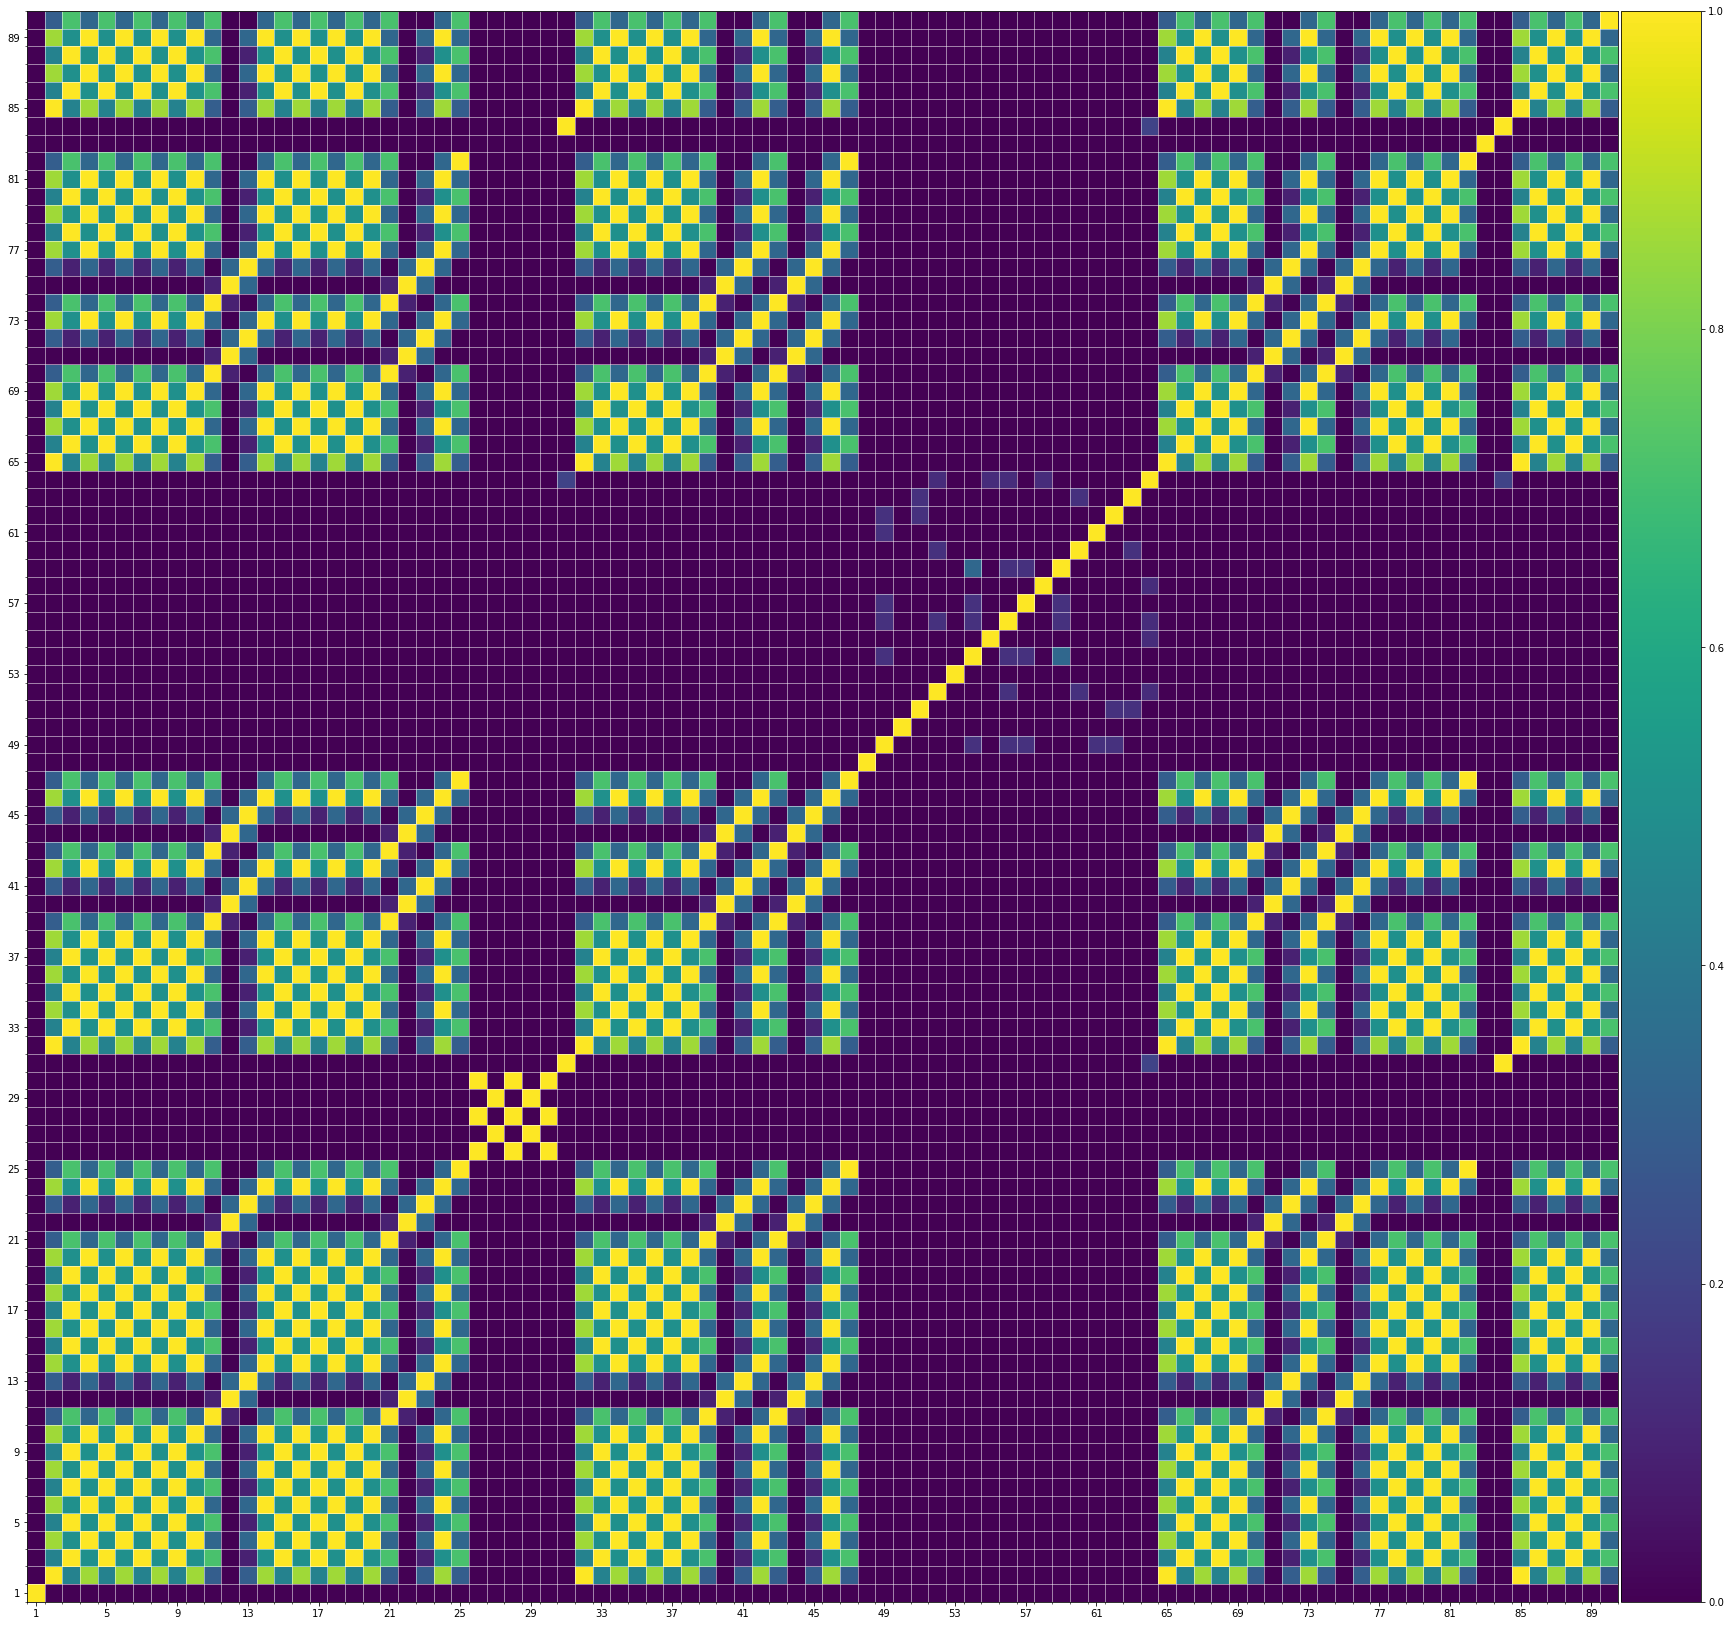
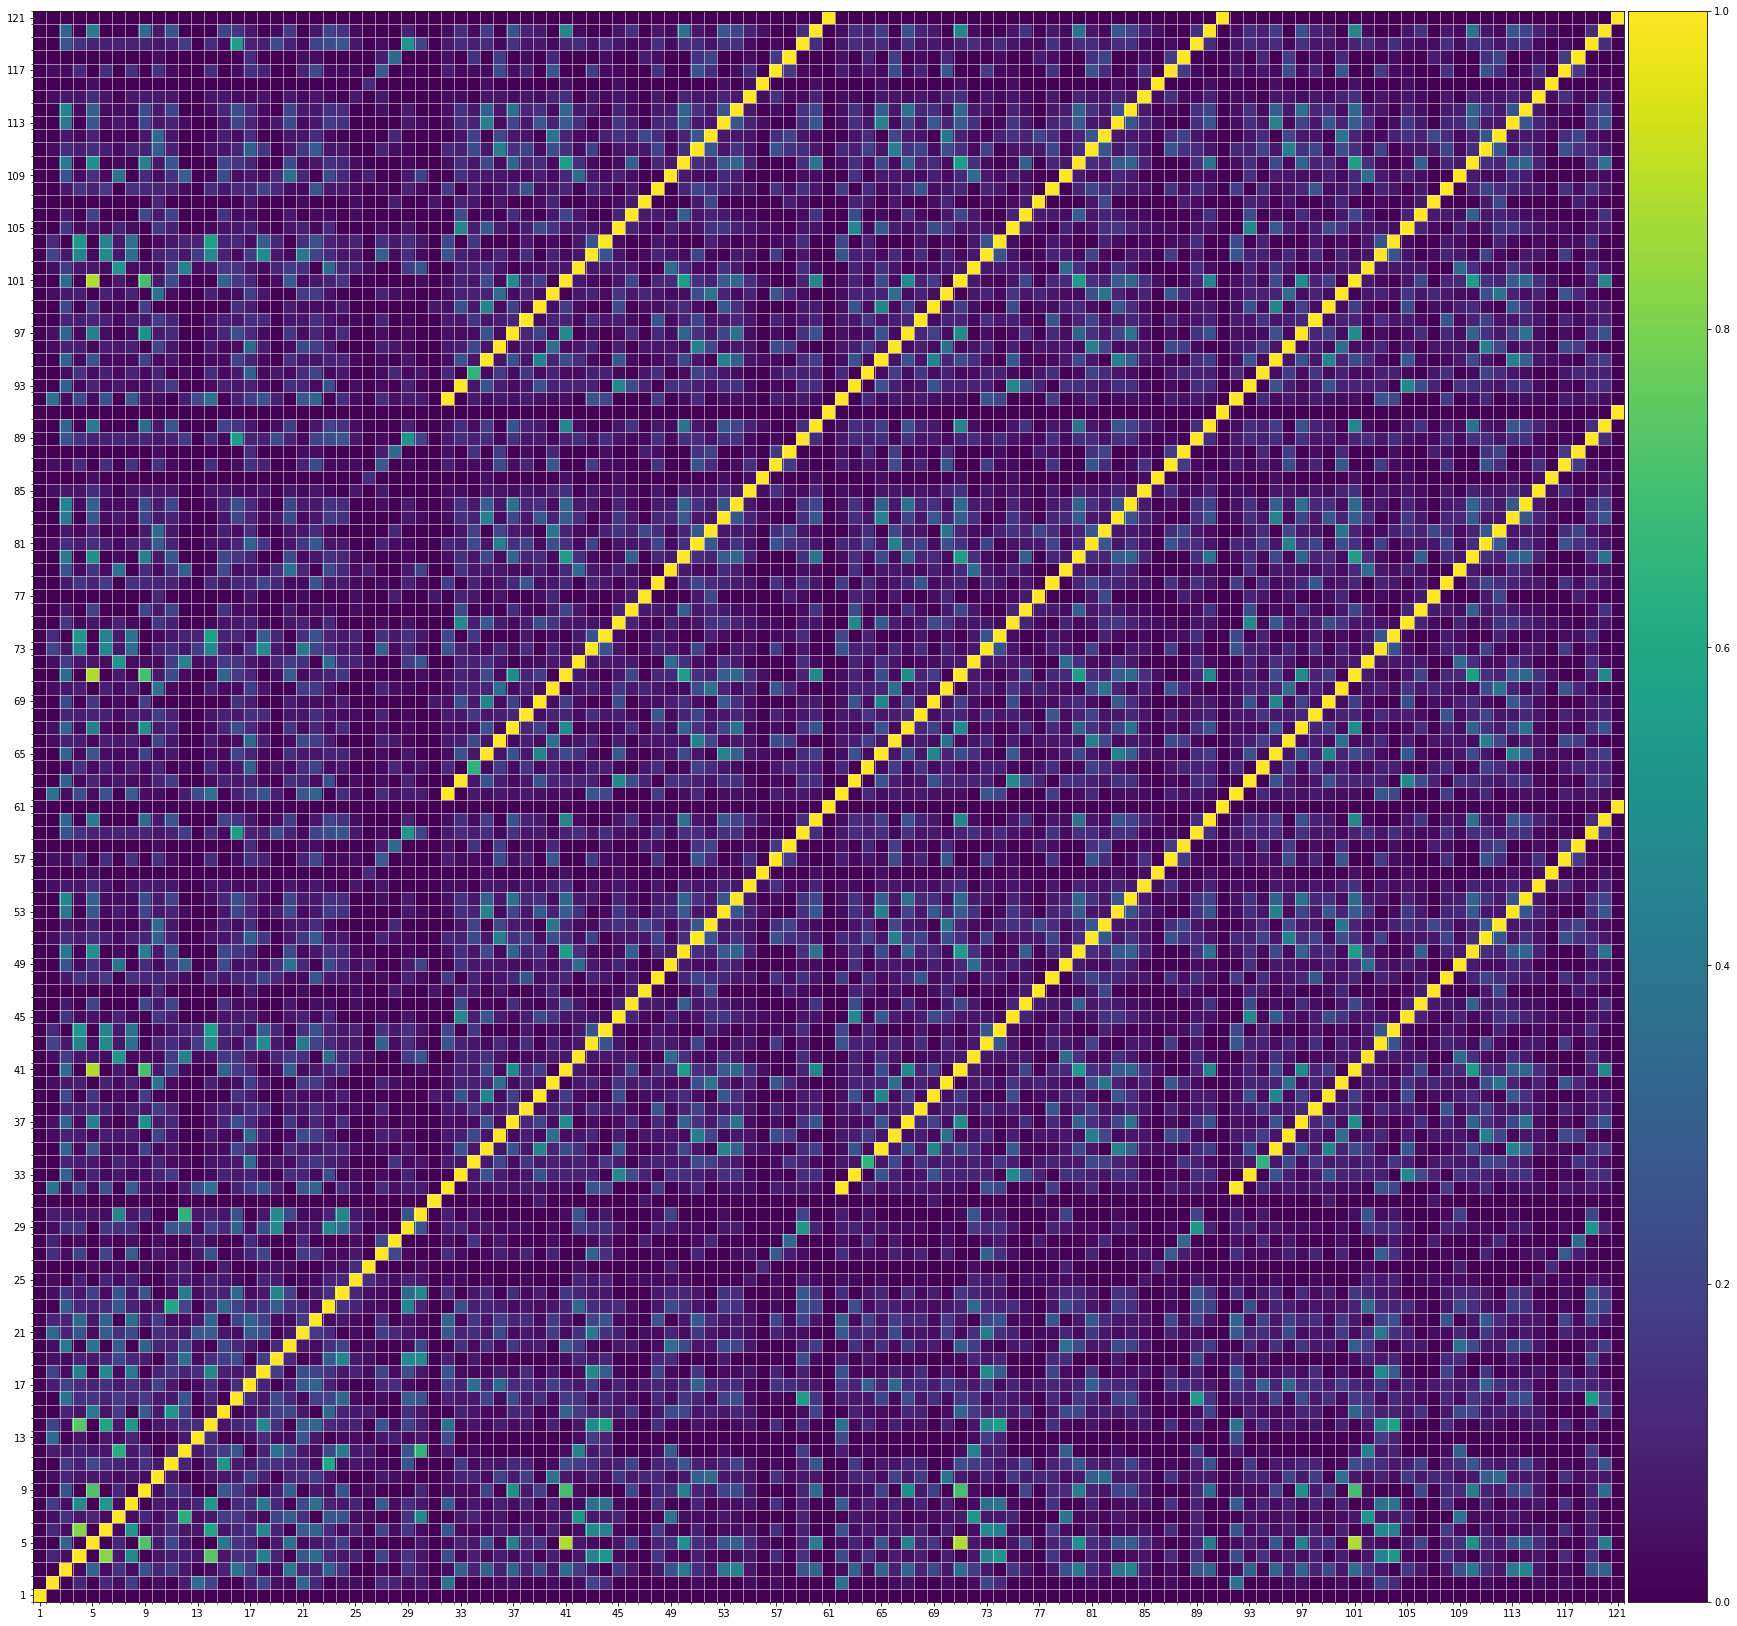
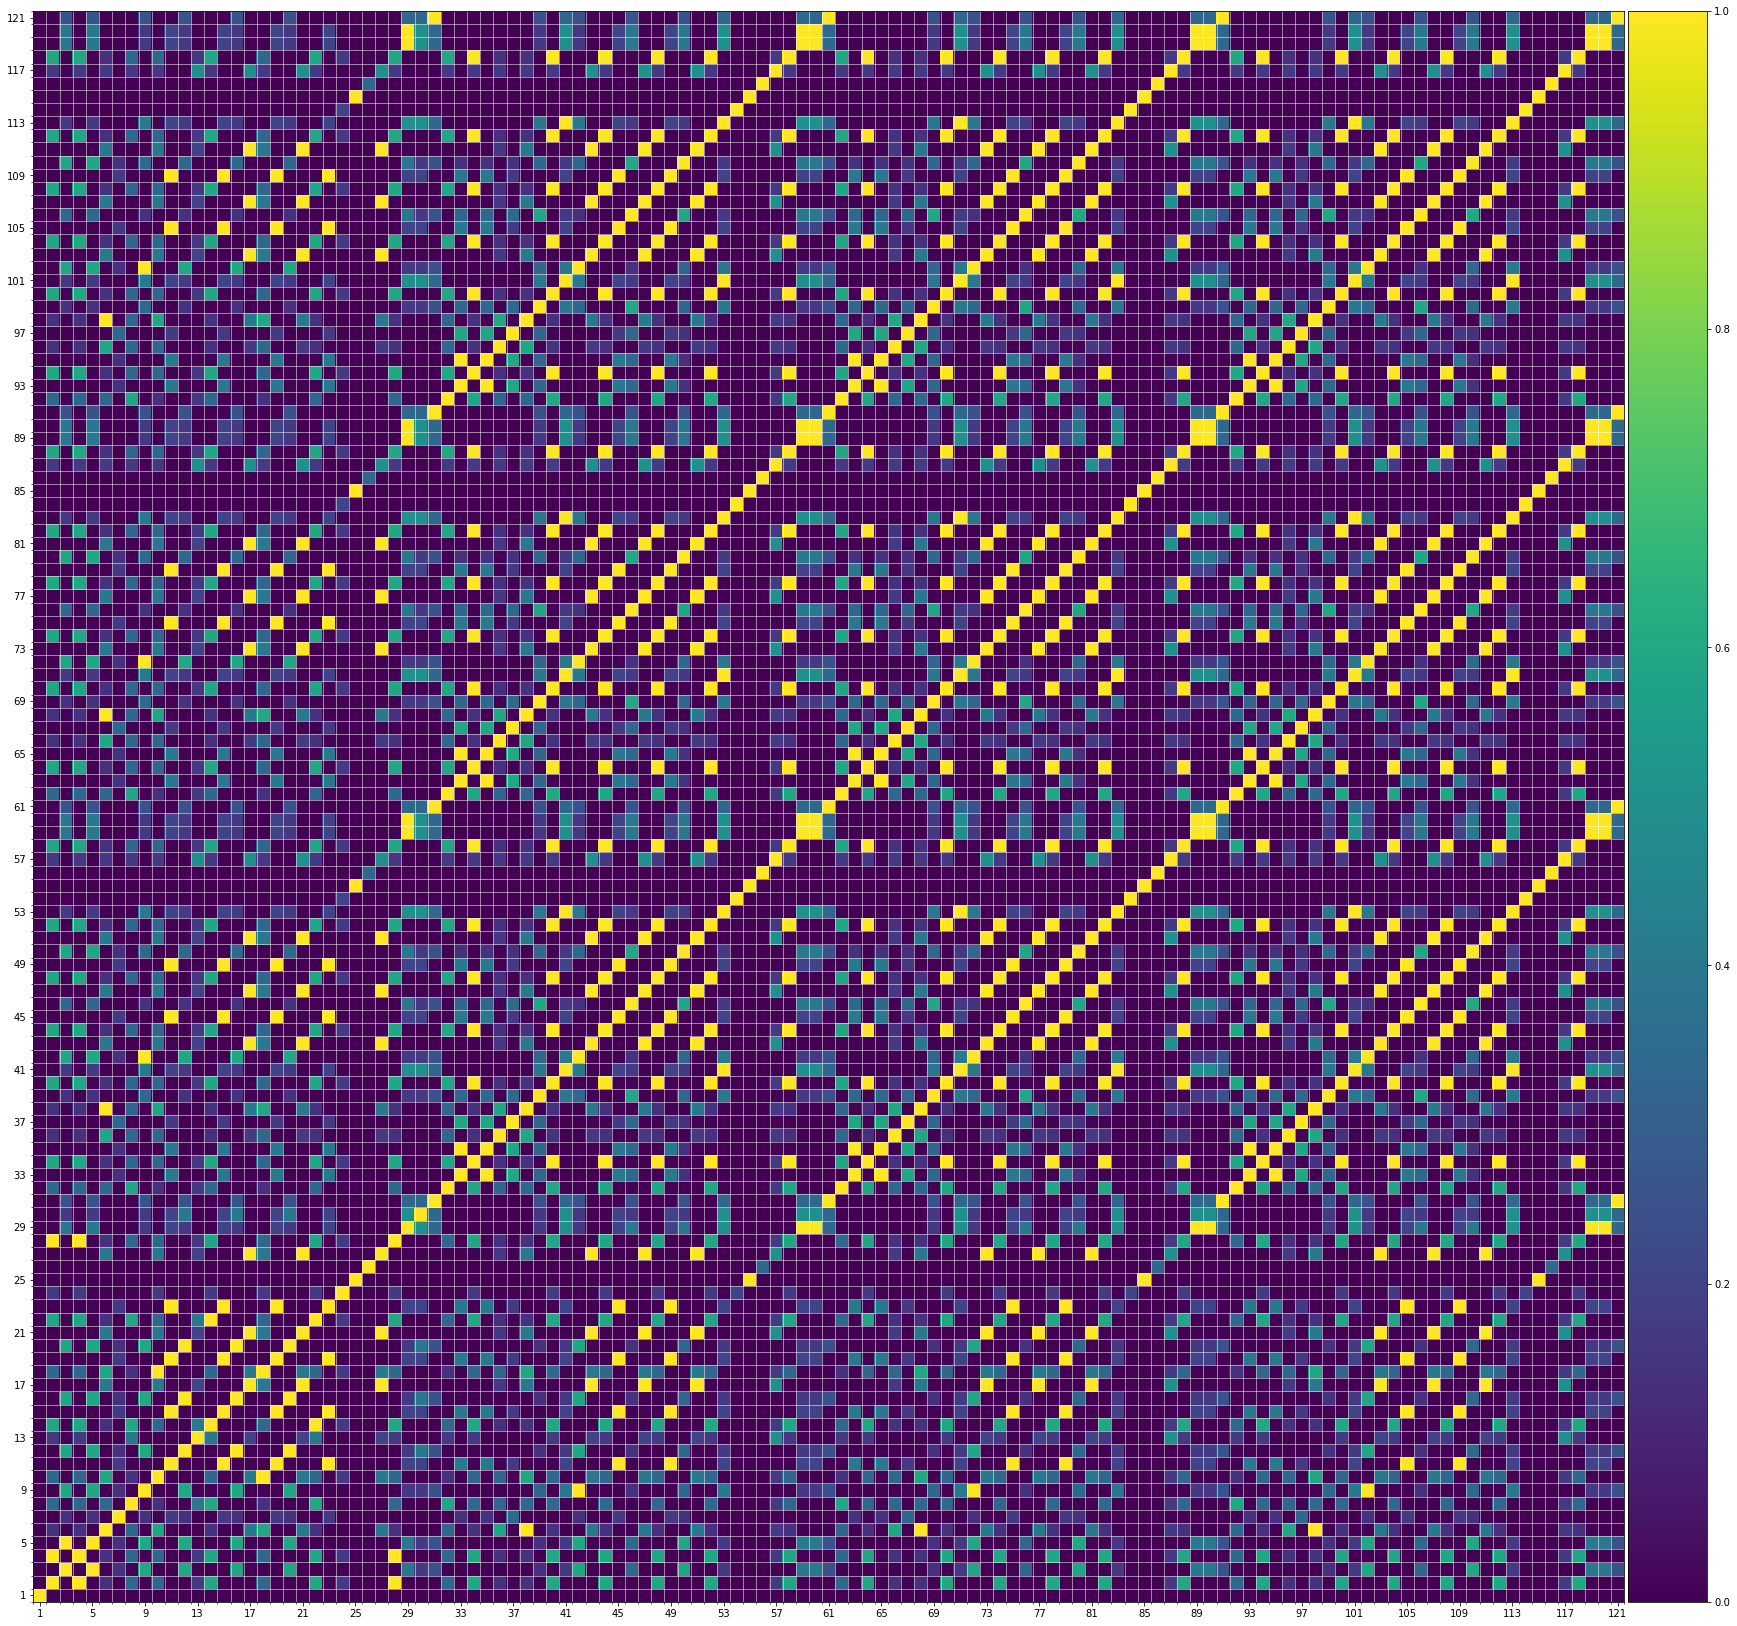
Using the same method of similarity computation described here, we visualize the self-similarity matrices of the Museformer demos on the demo page, to vividly show the structures, as well as our ability to generate music with variations instead of simply copying. The similarities are computed over the melody track.Demo 1 (midi)

Demo 2 (midi)

Demo 3 (midi)

Demo 4 (midi)


Training Samples
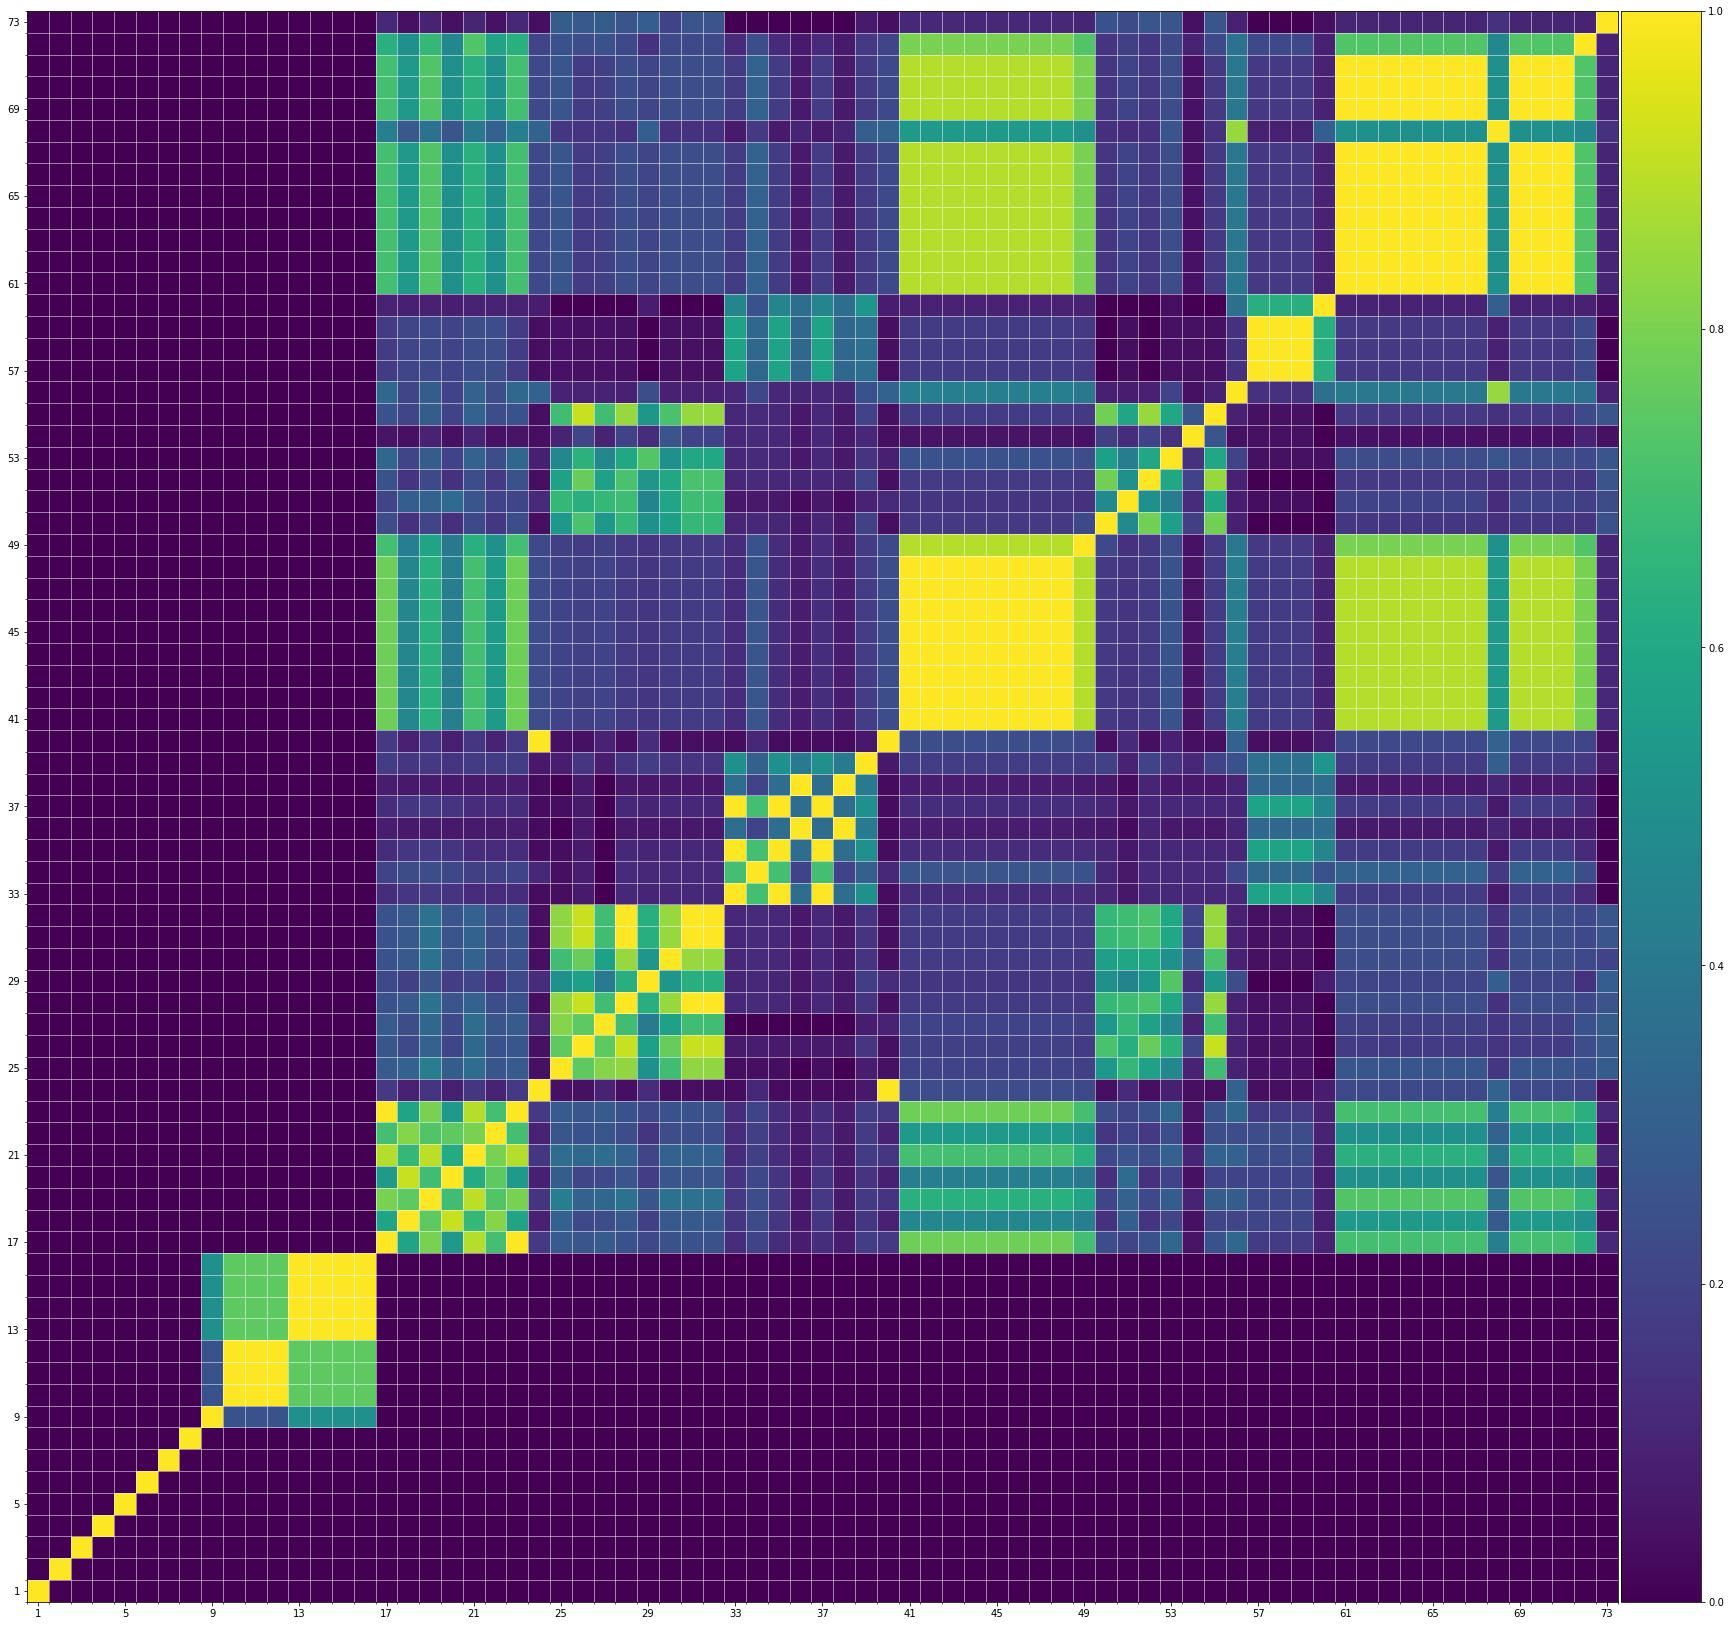
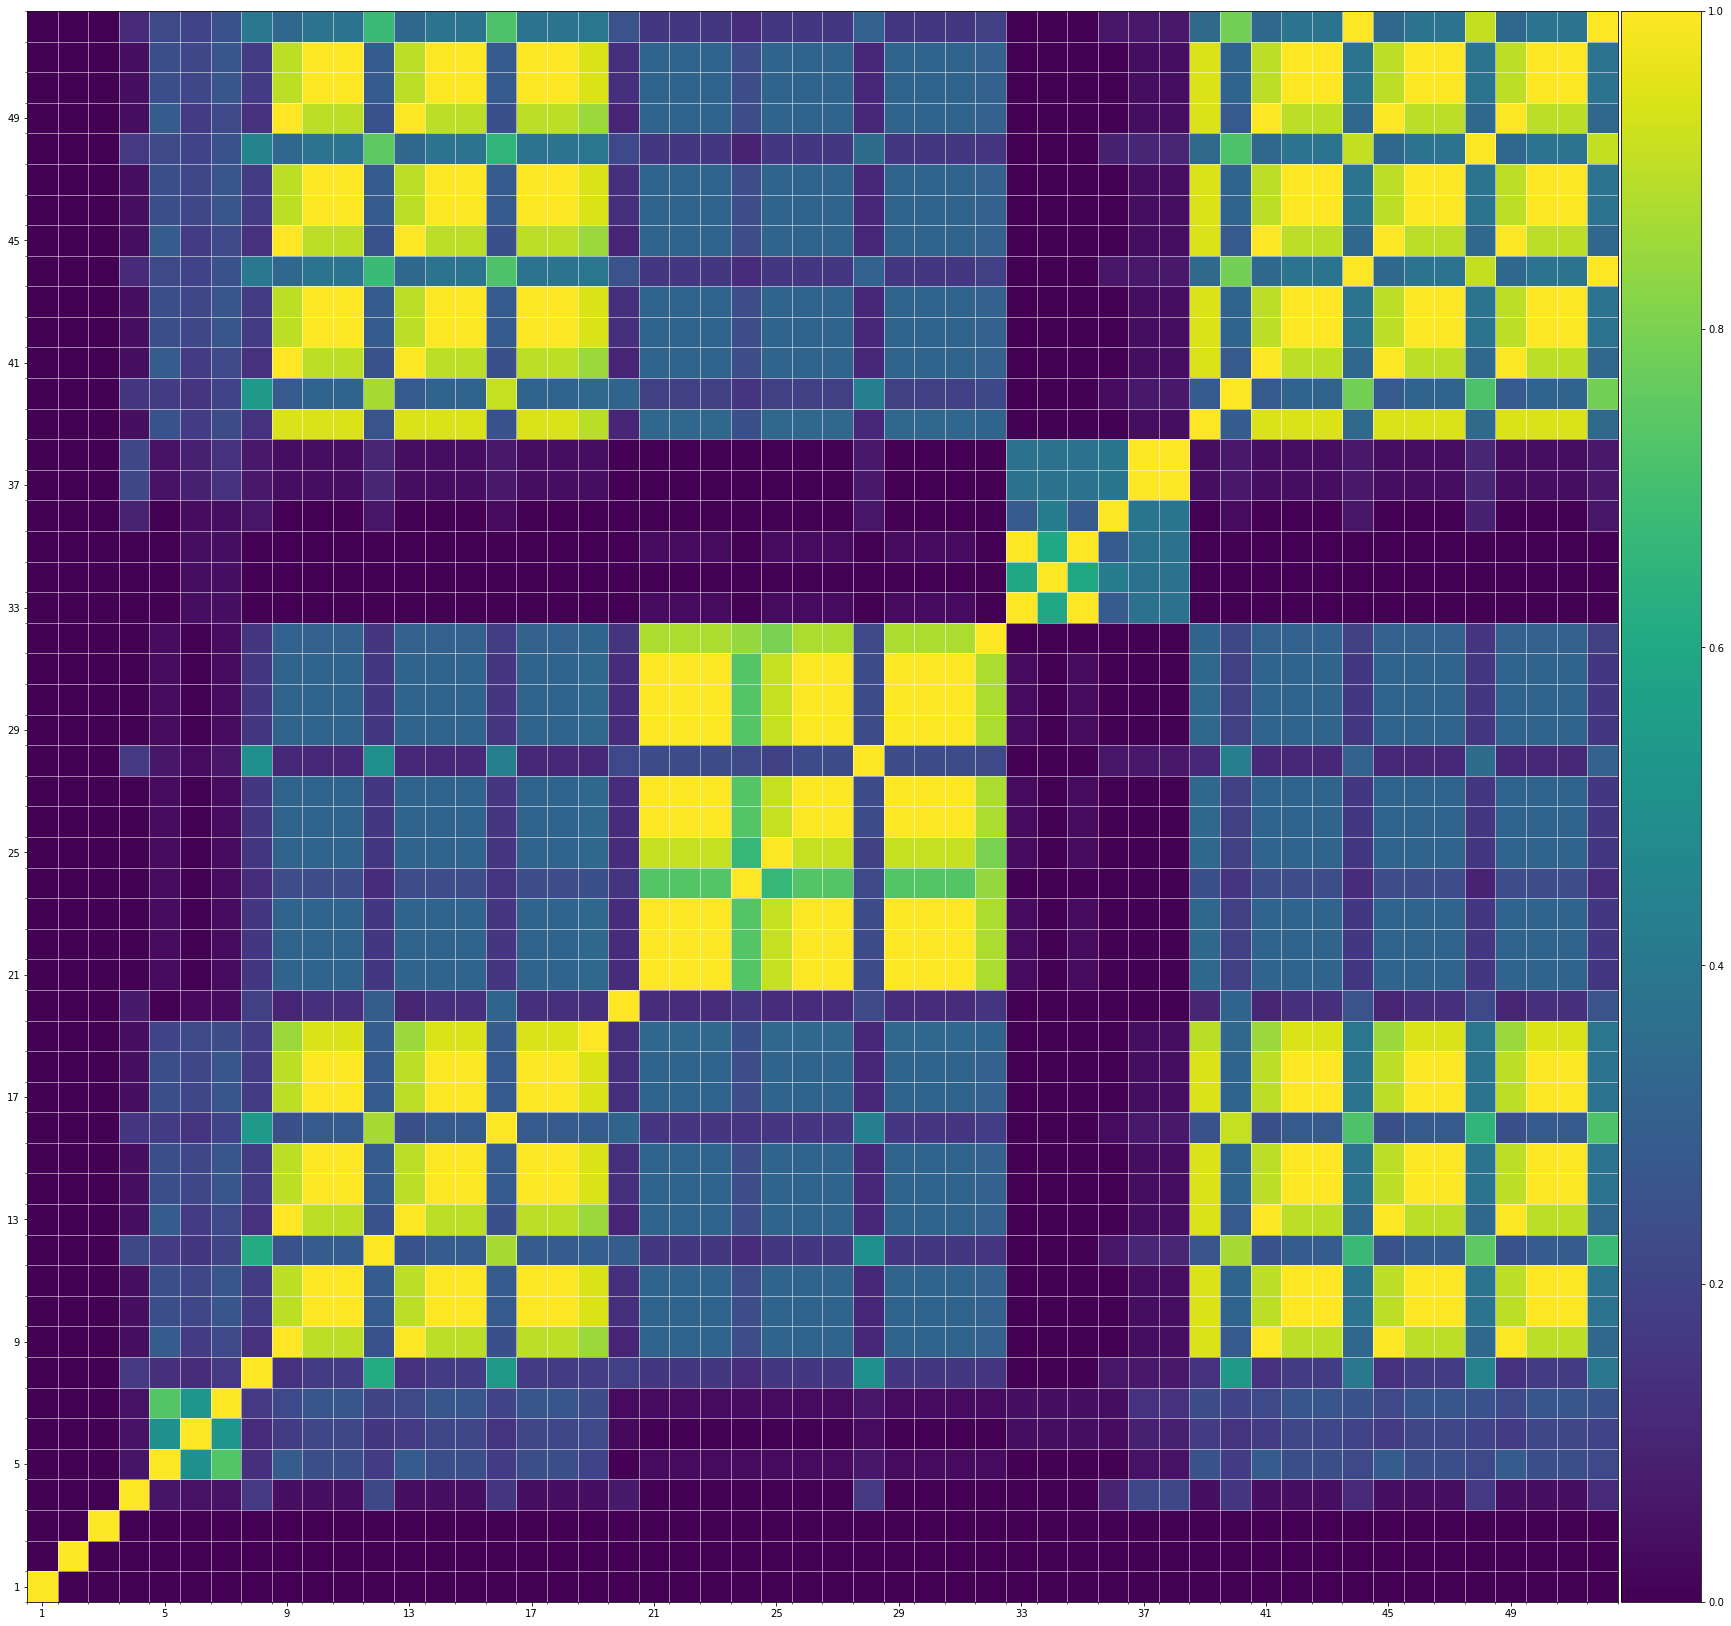
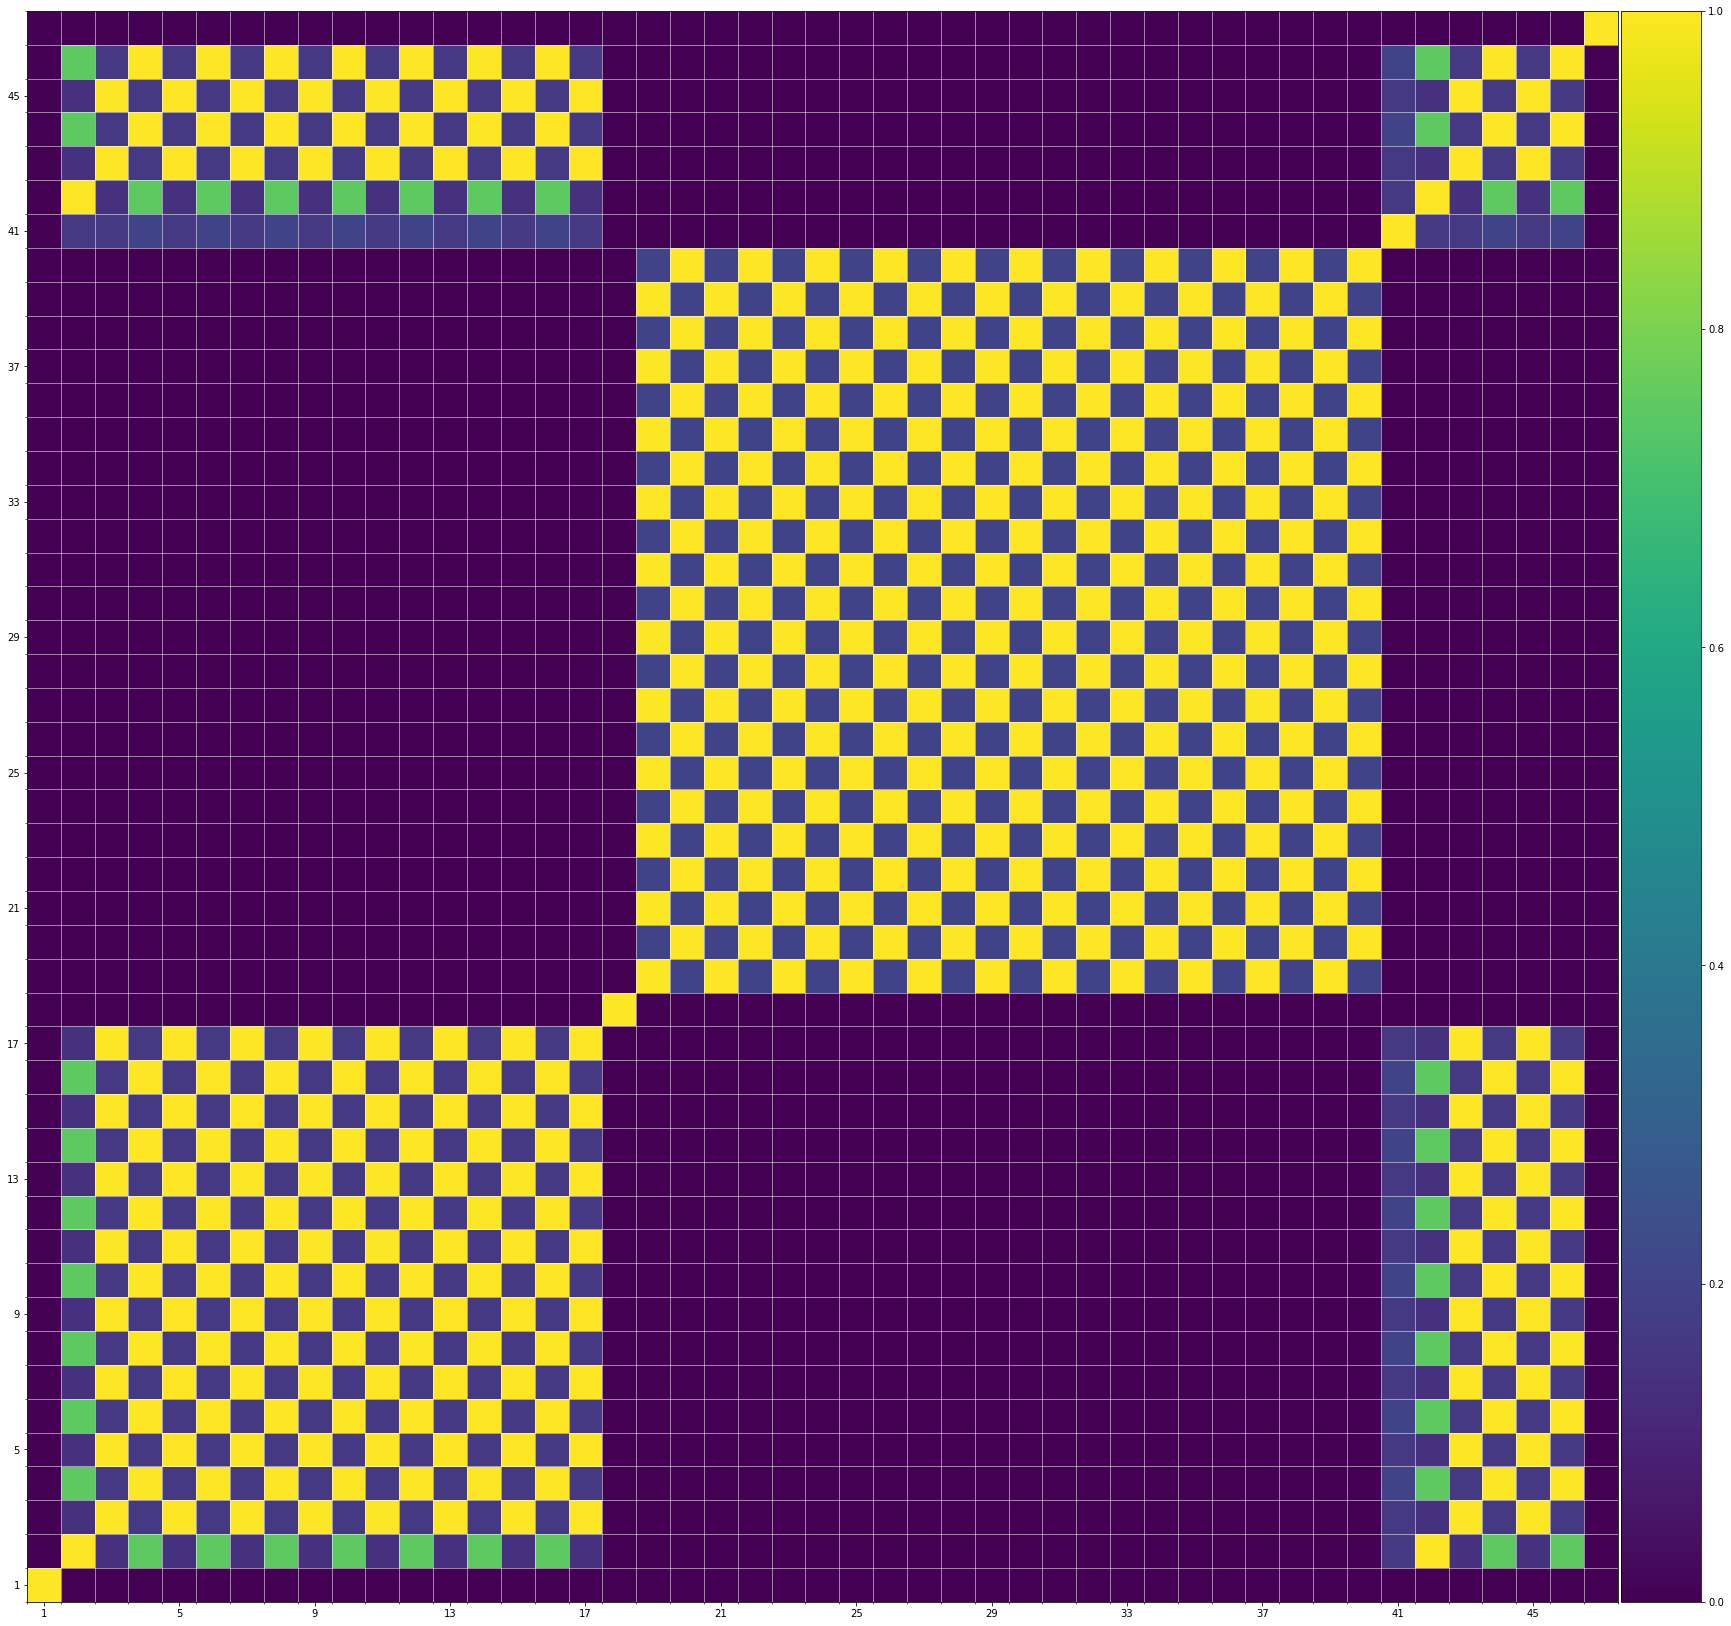
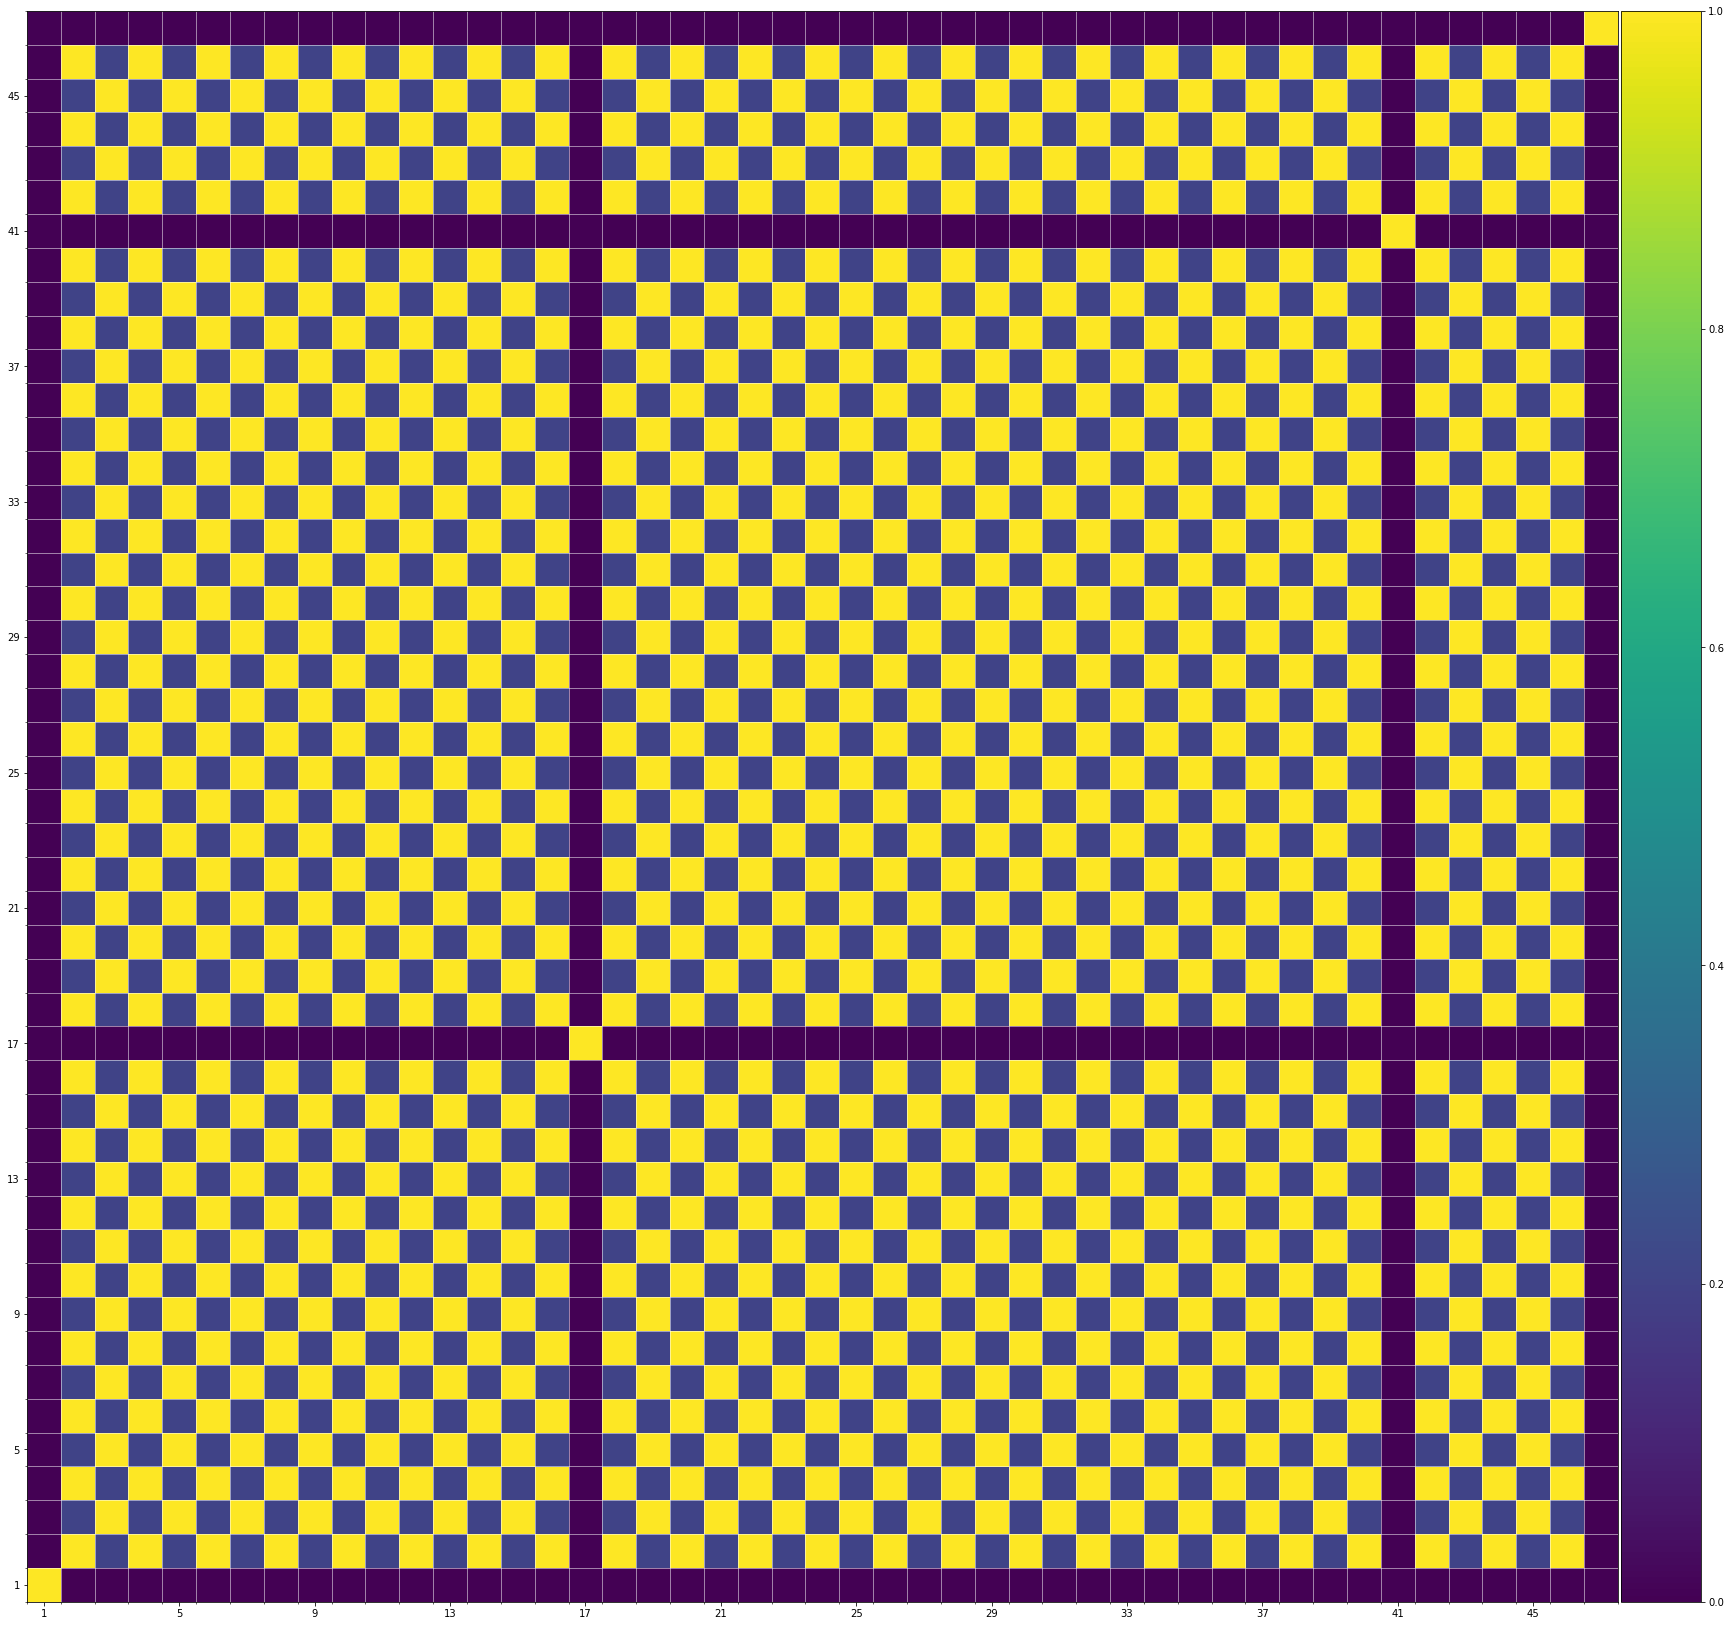
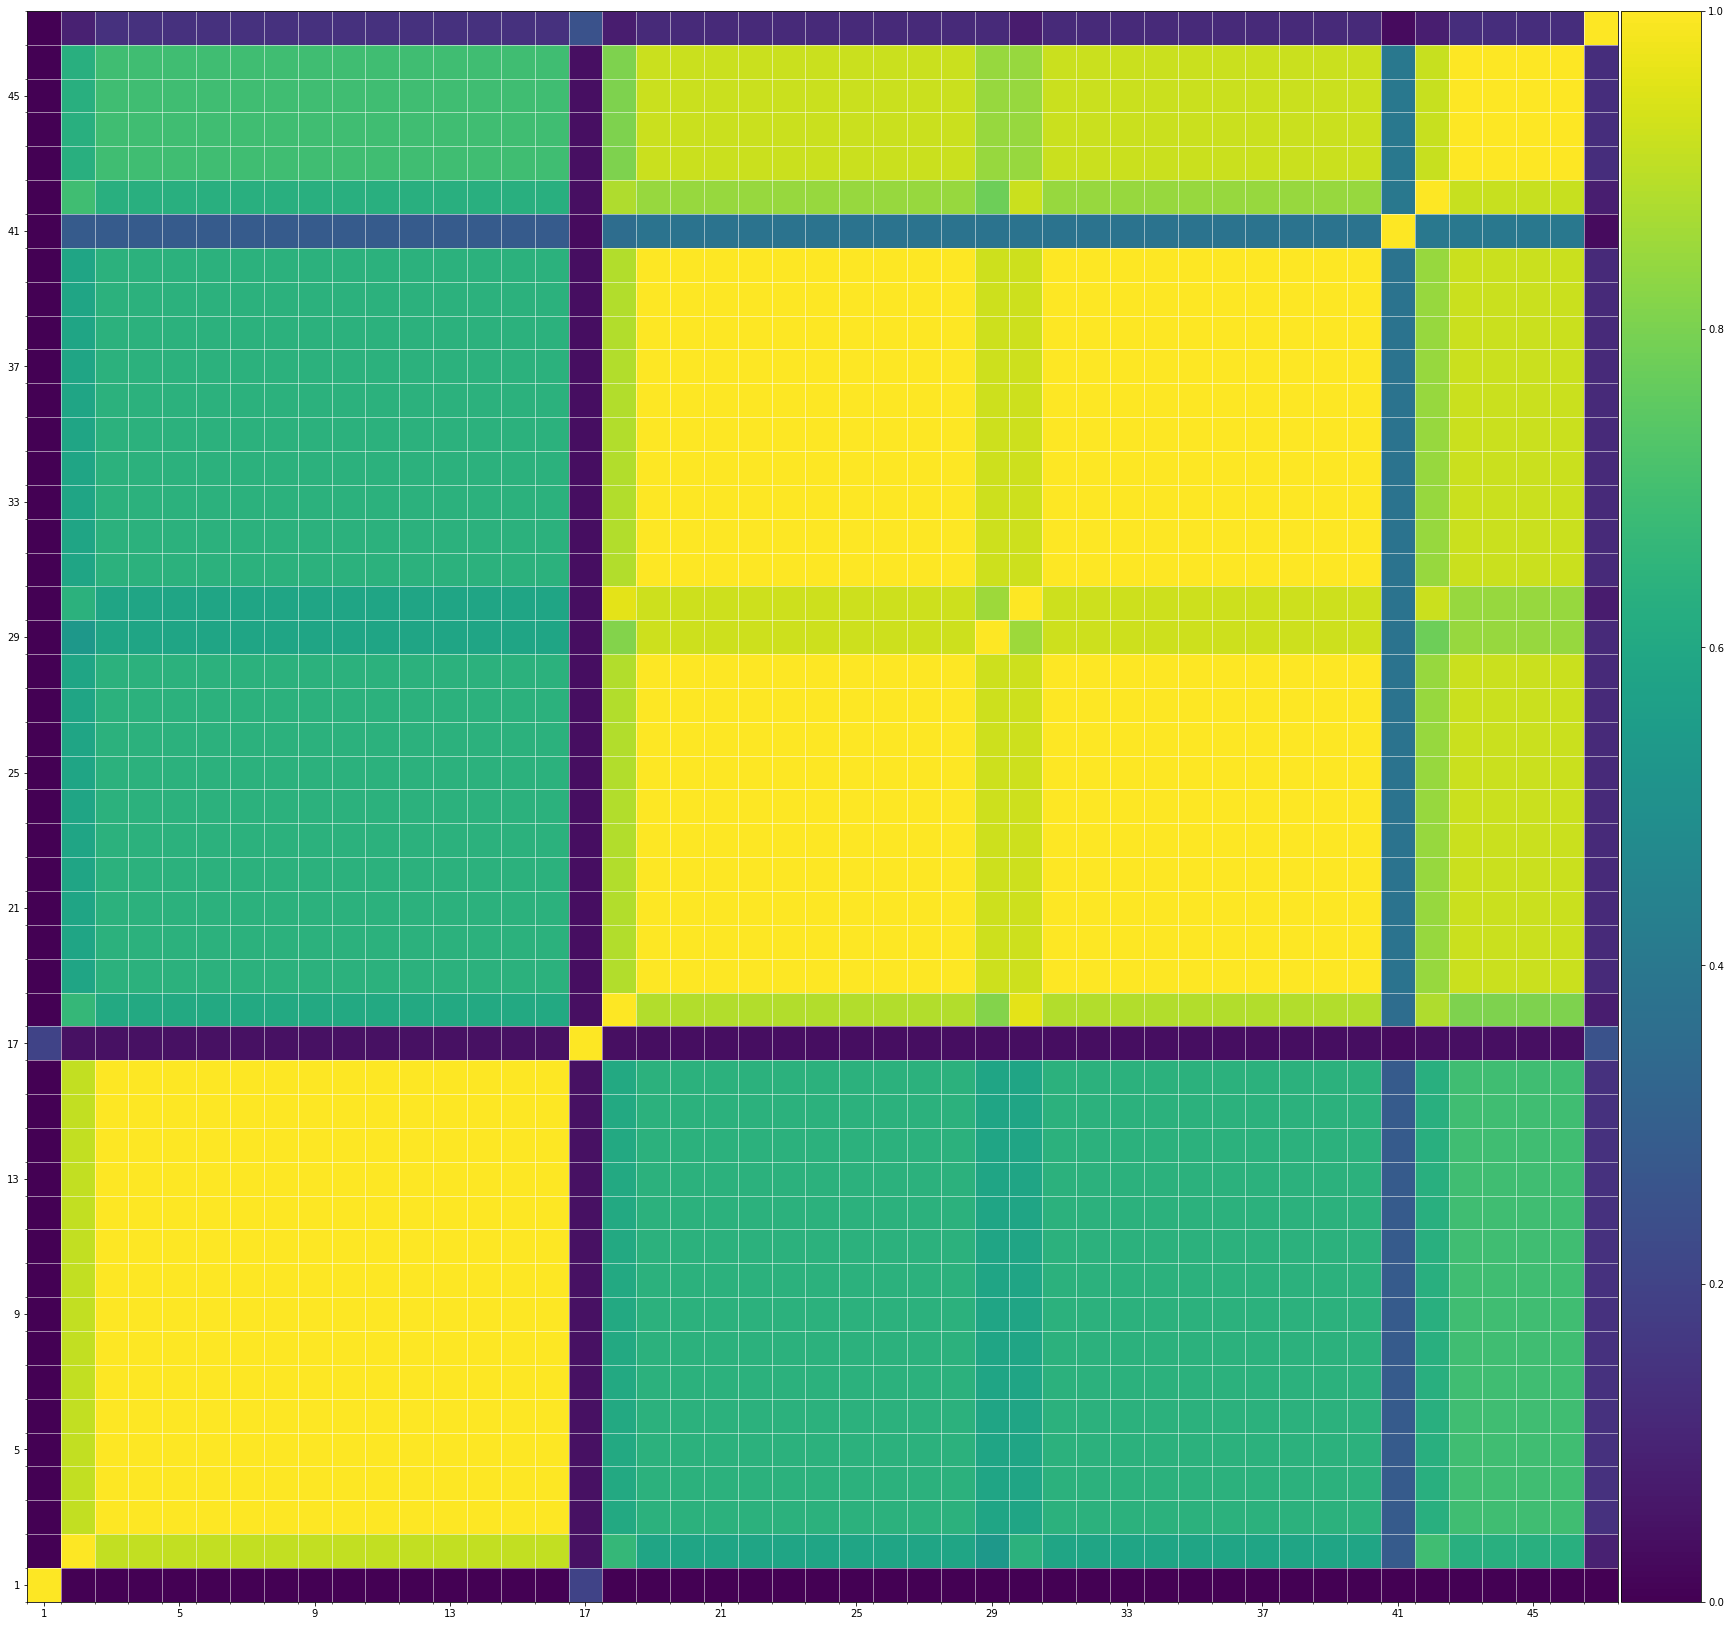
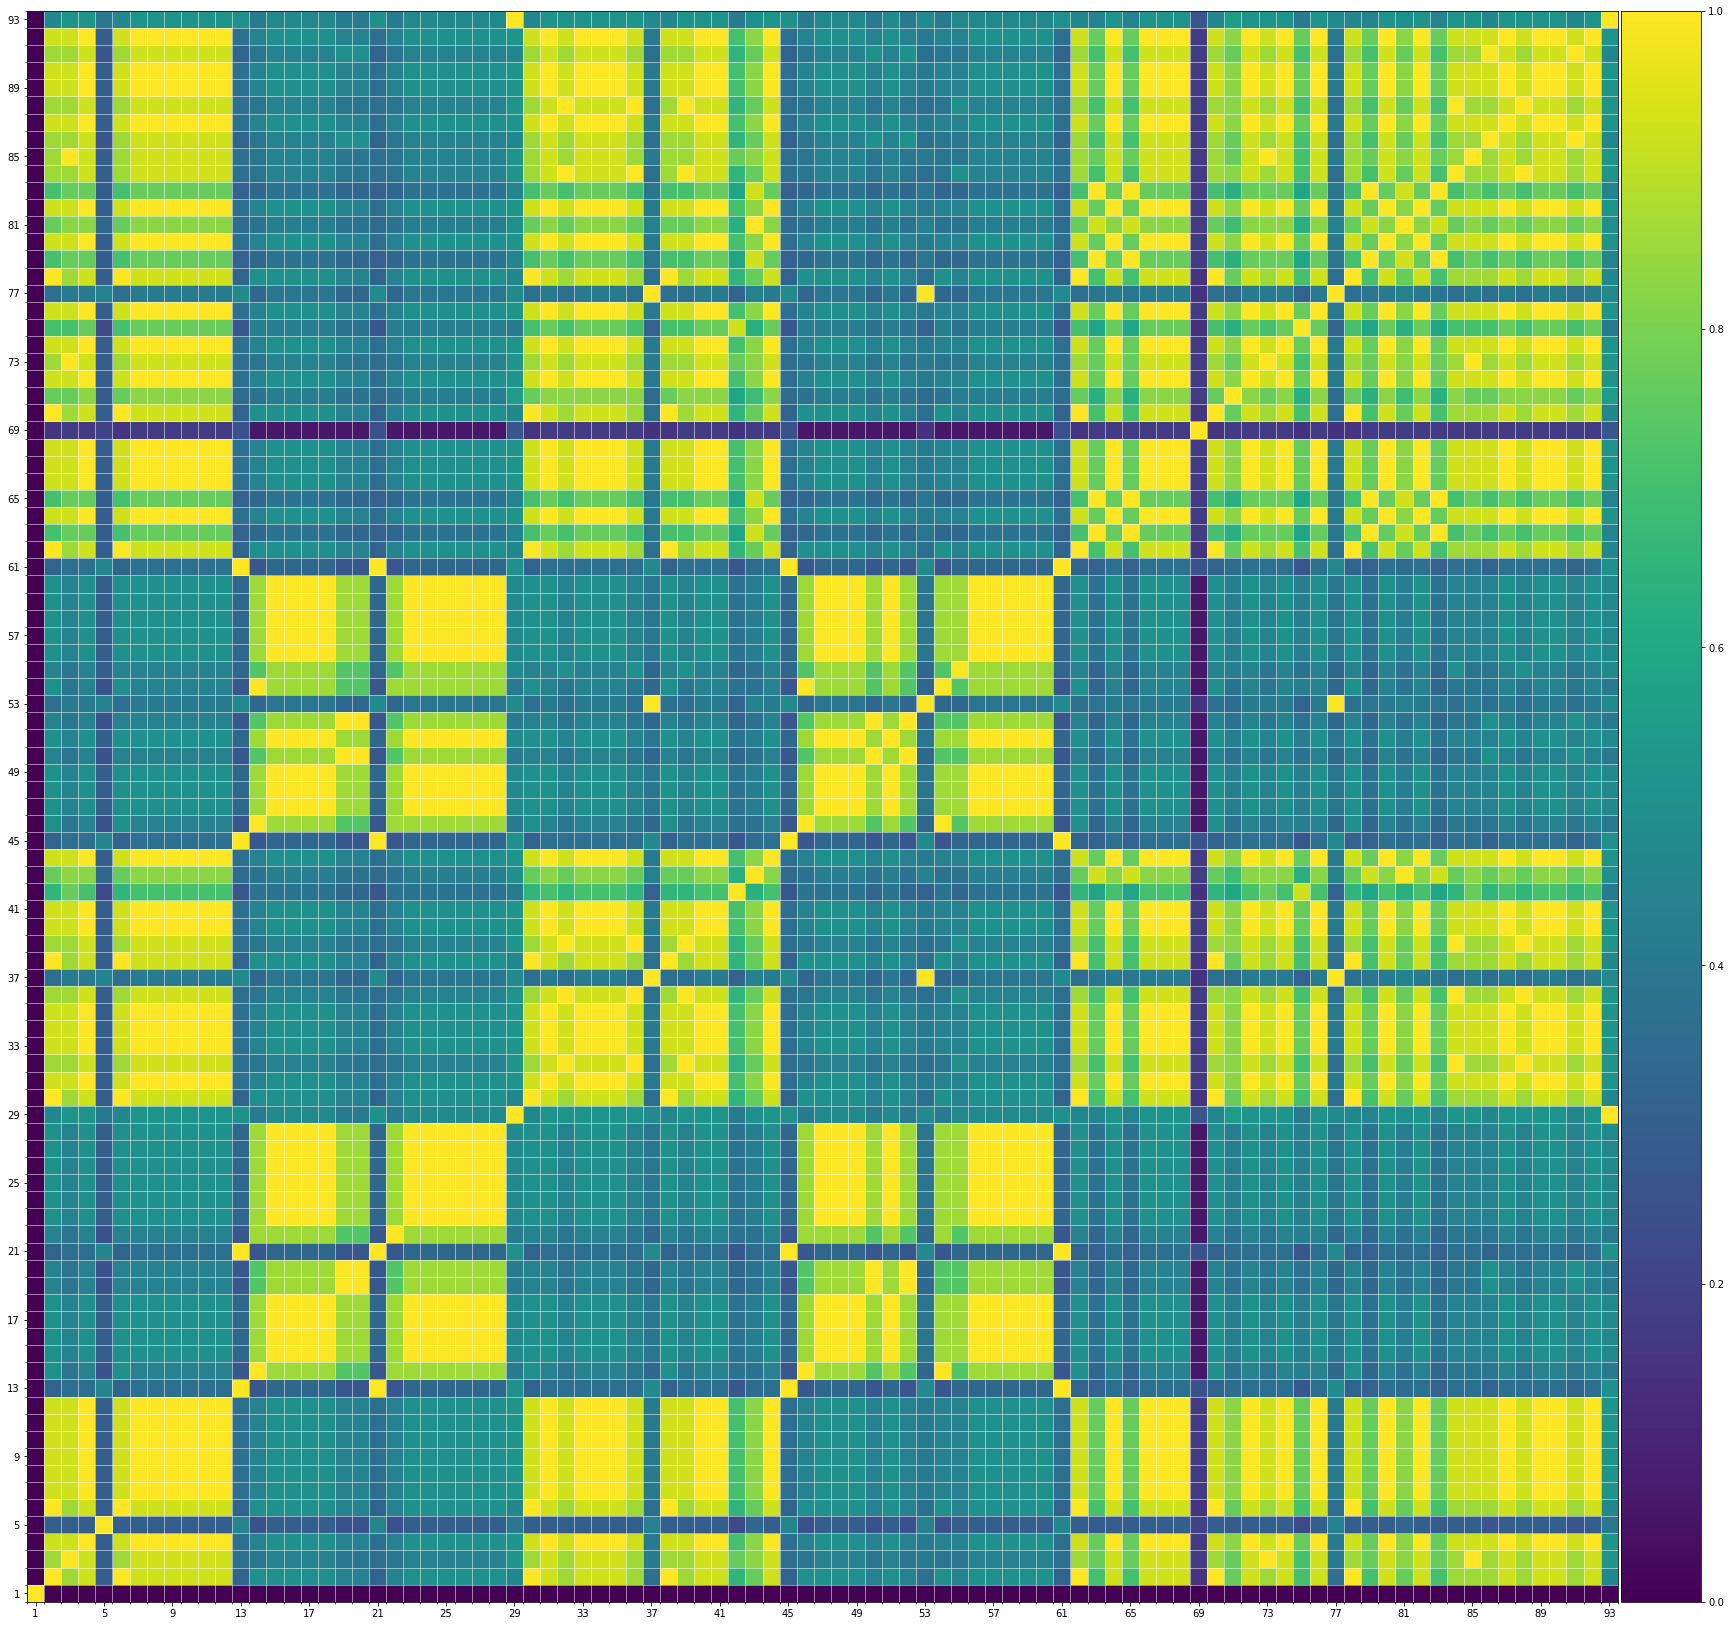
We also show the SSMs of 3 randomly picked training samples FYI. Please click the following buttons to see them:| midi |

| midi |
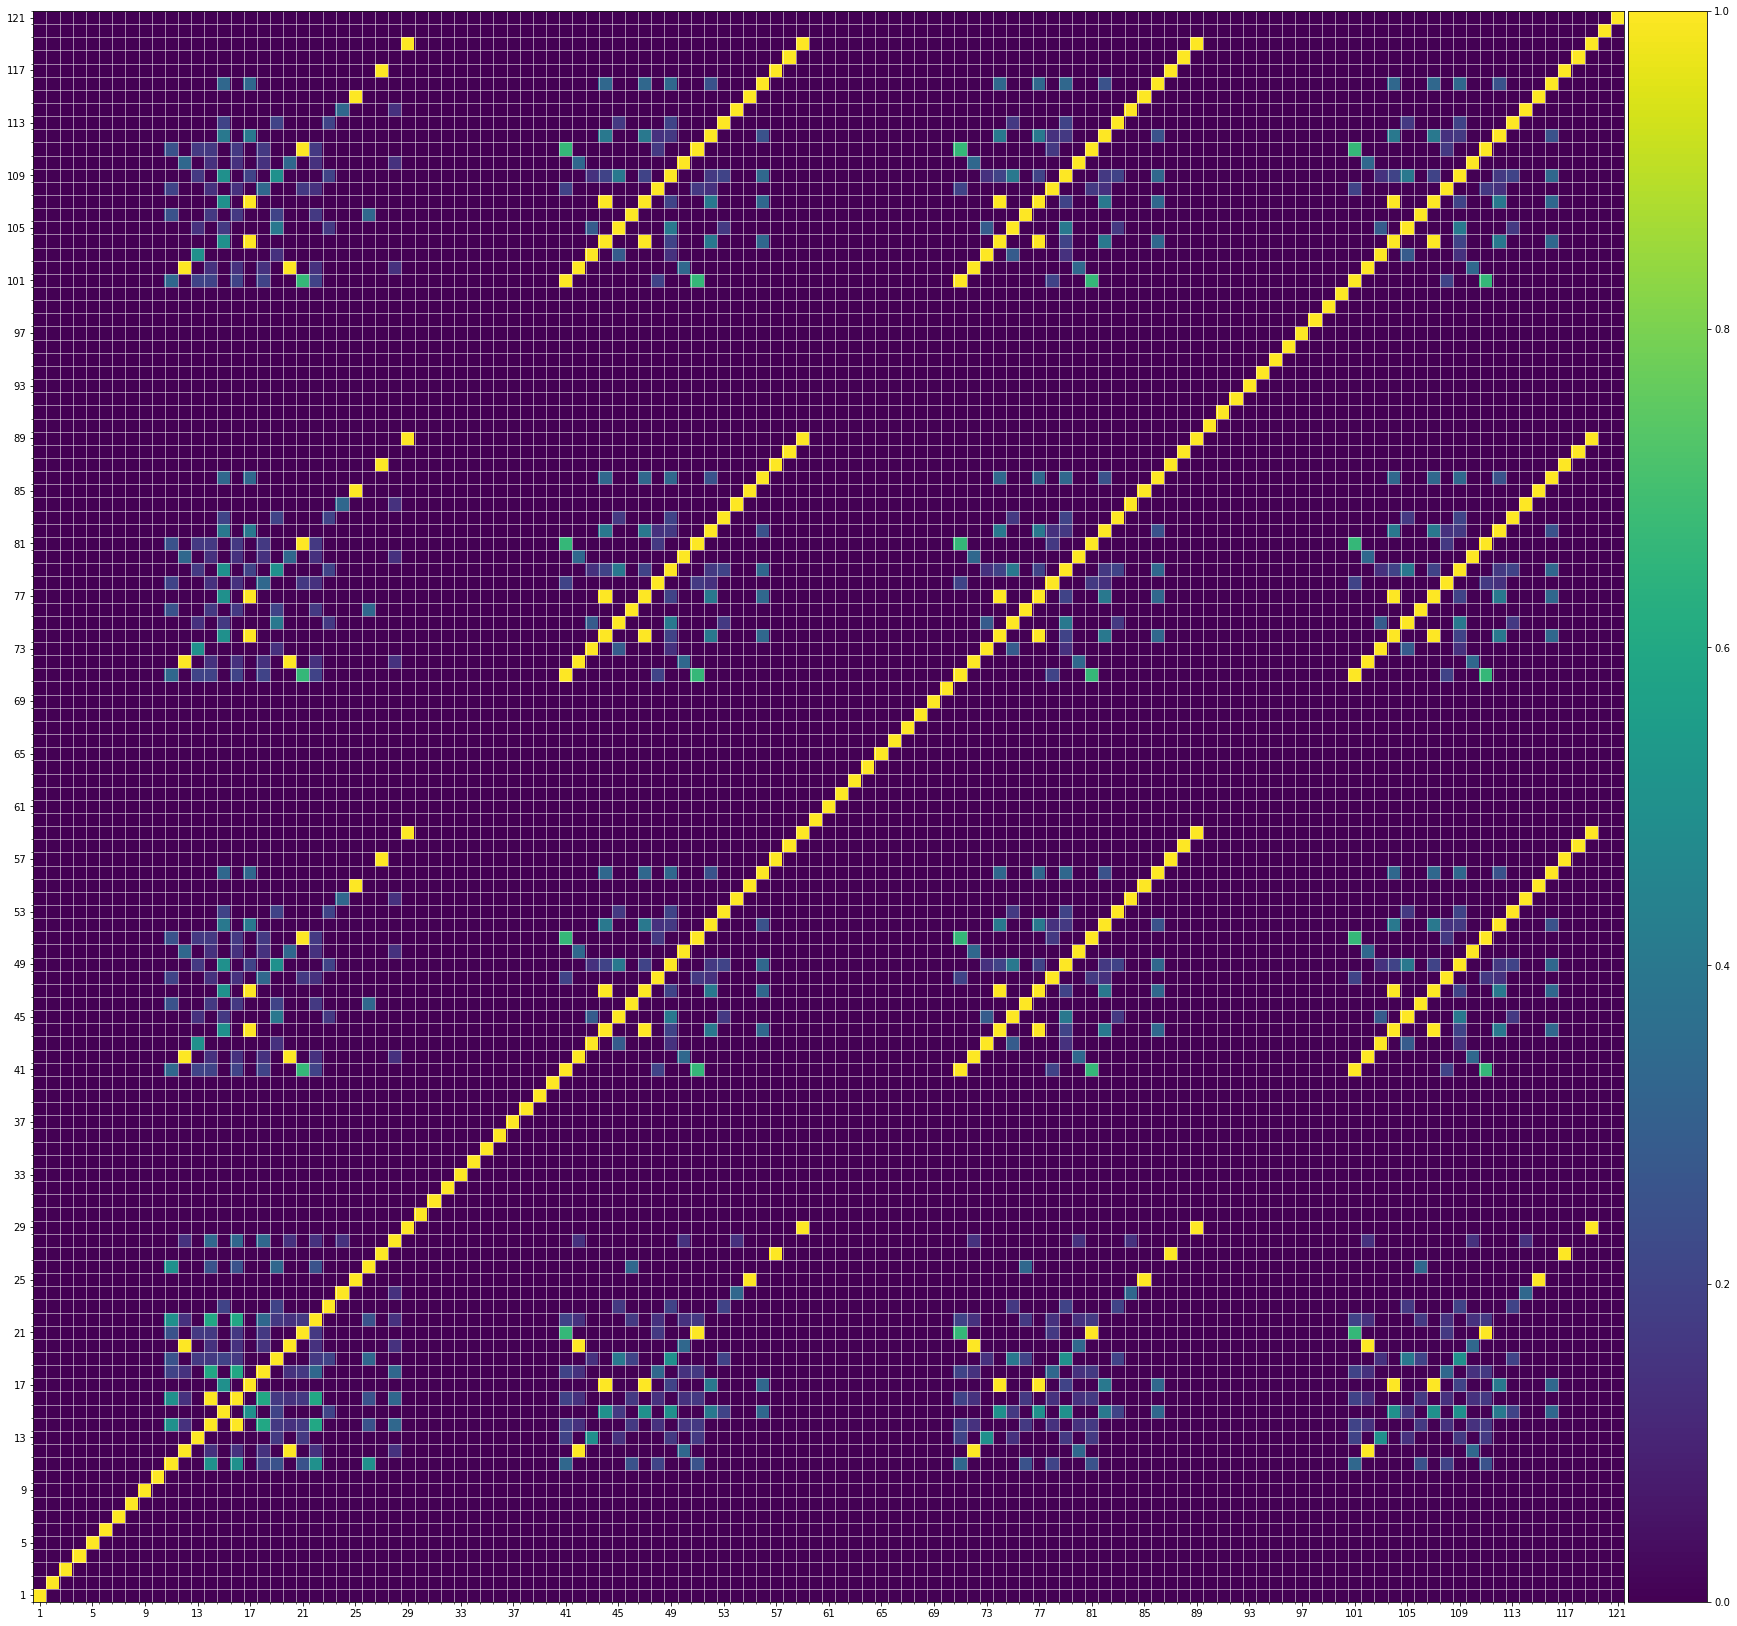
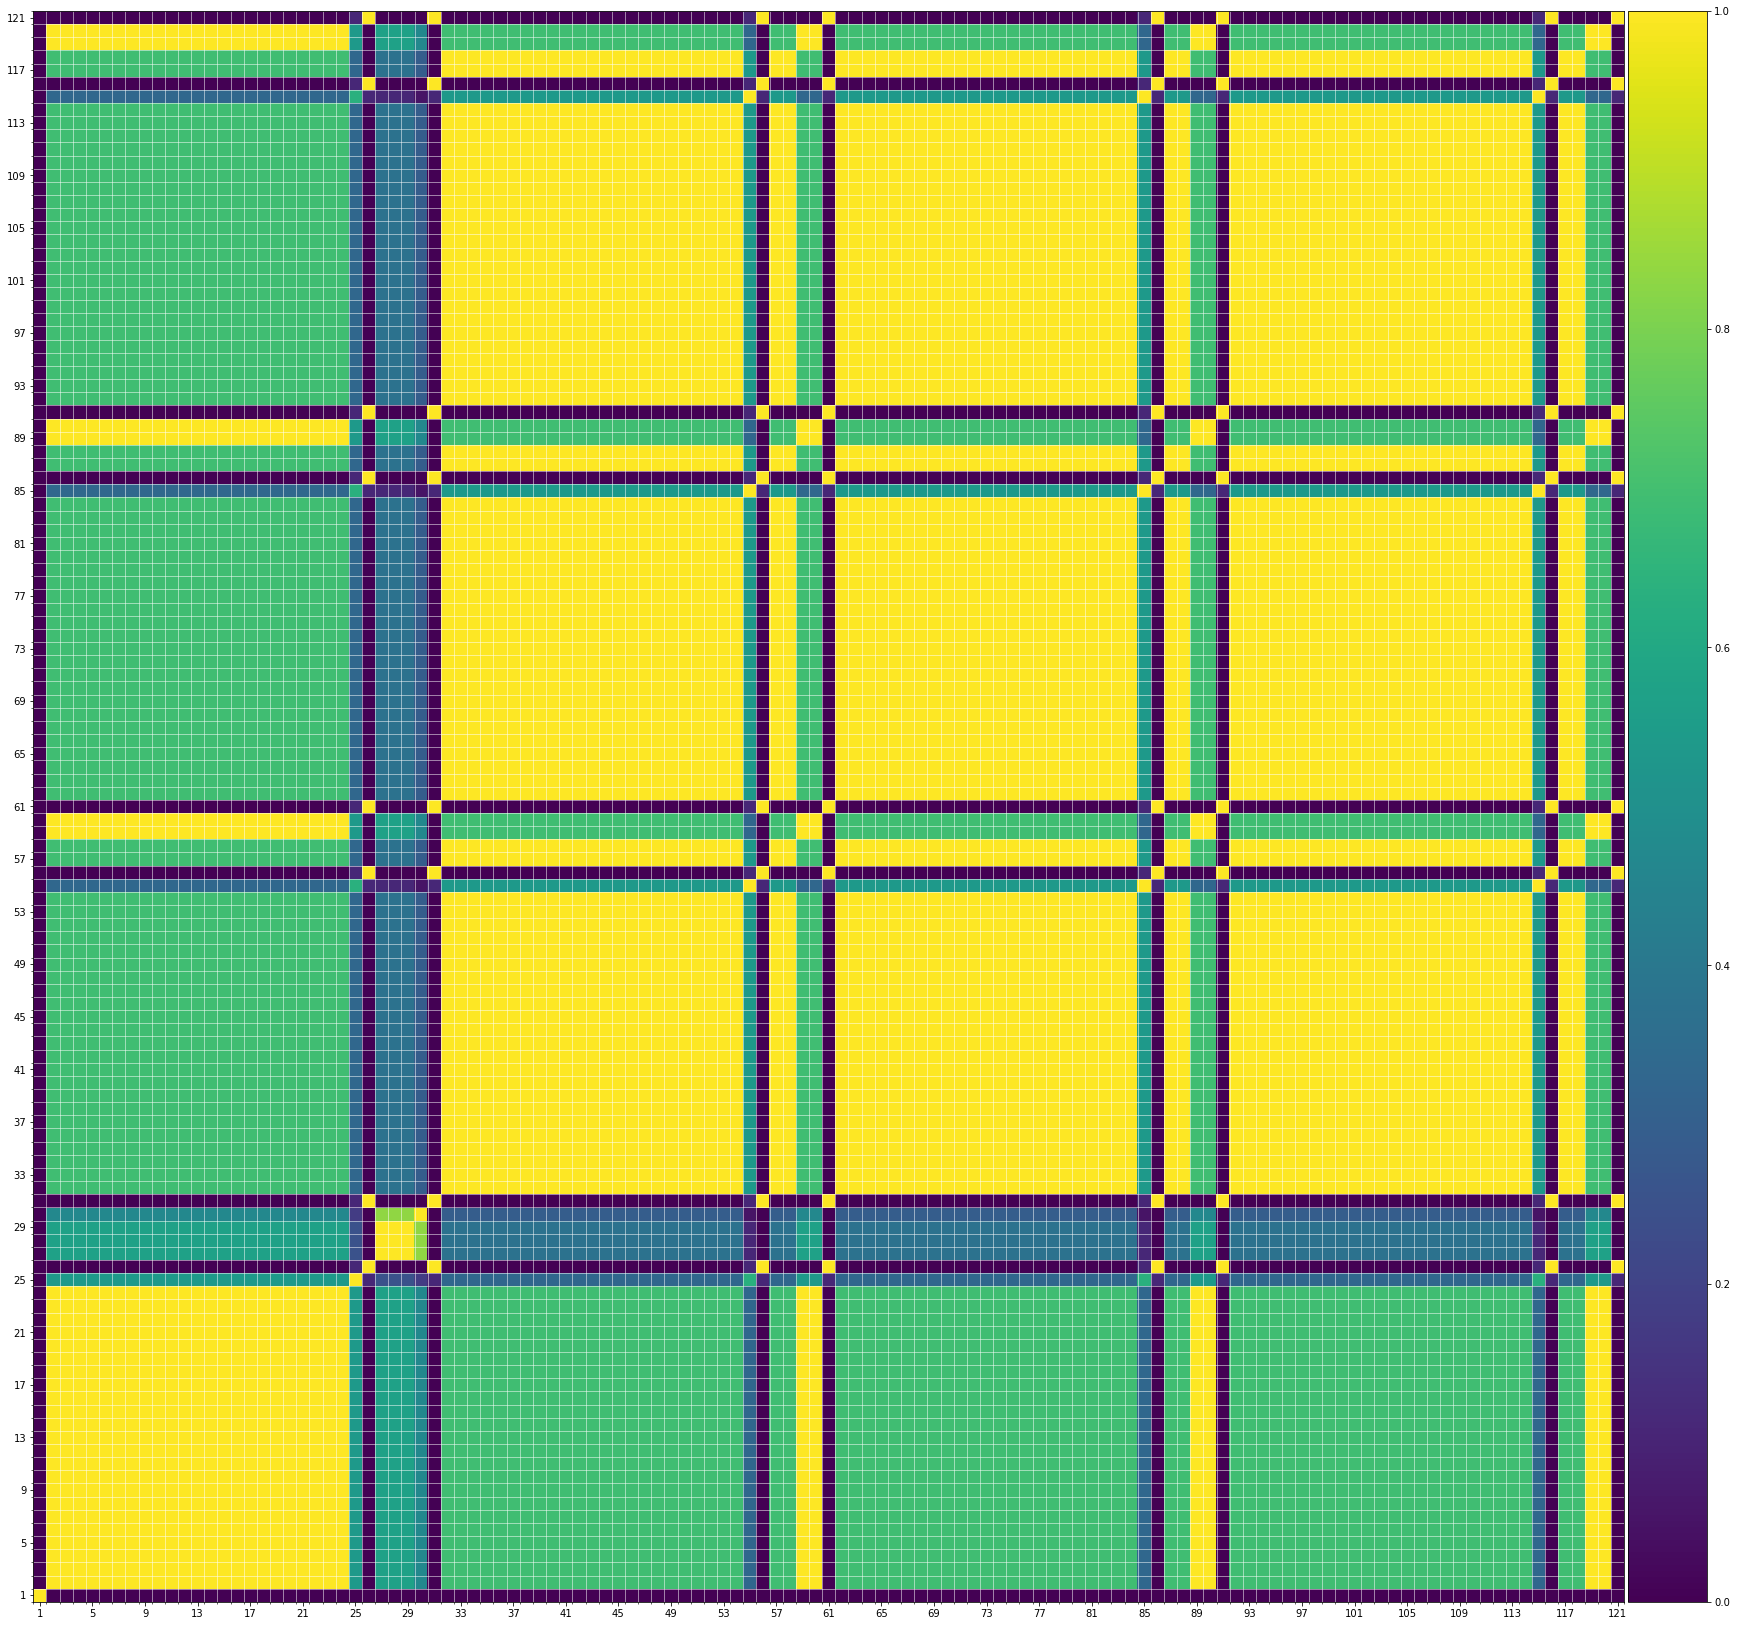
| midi |
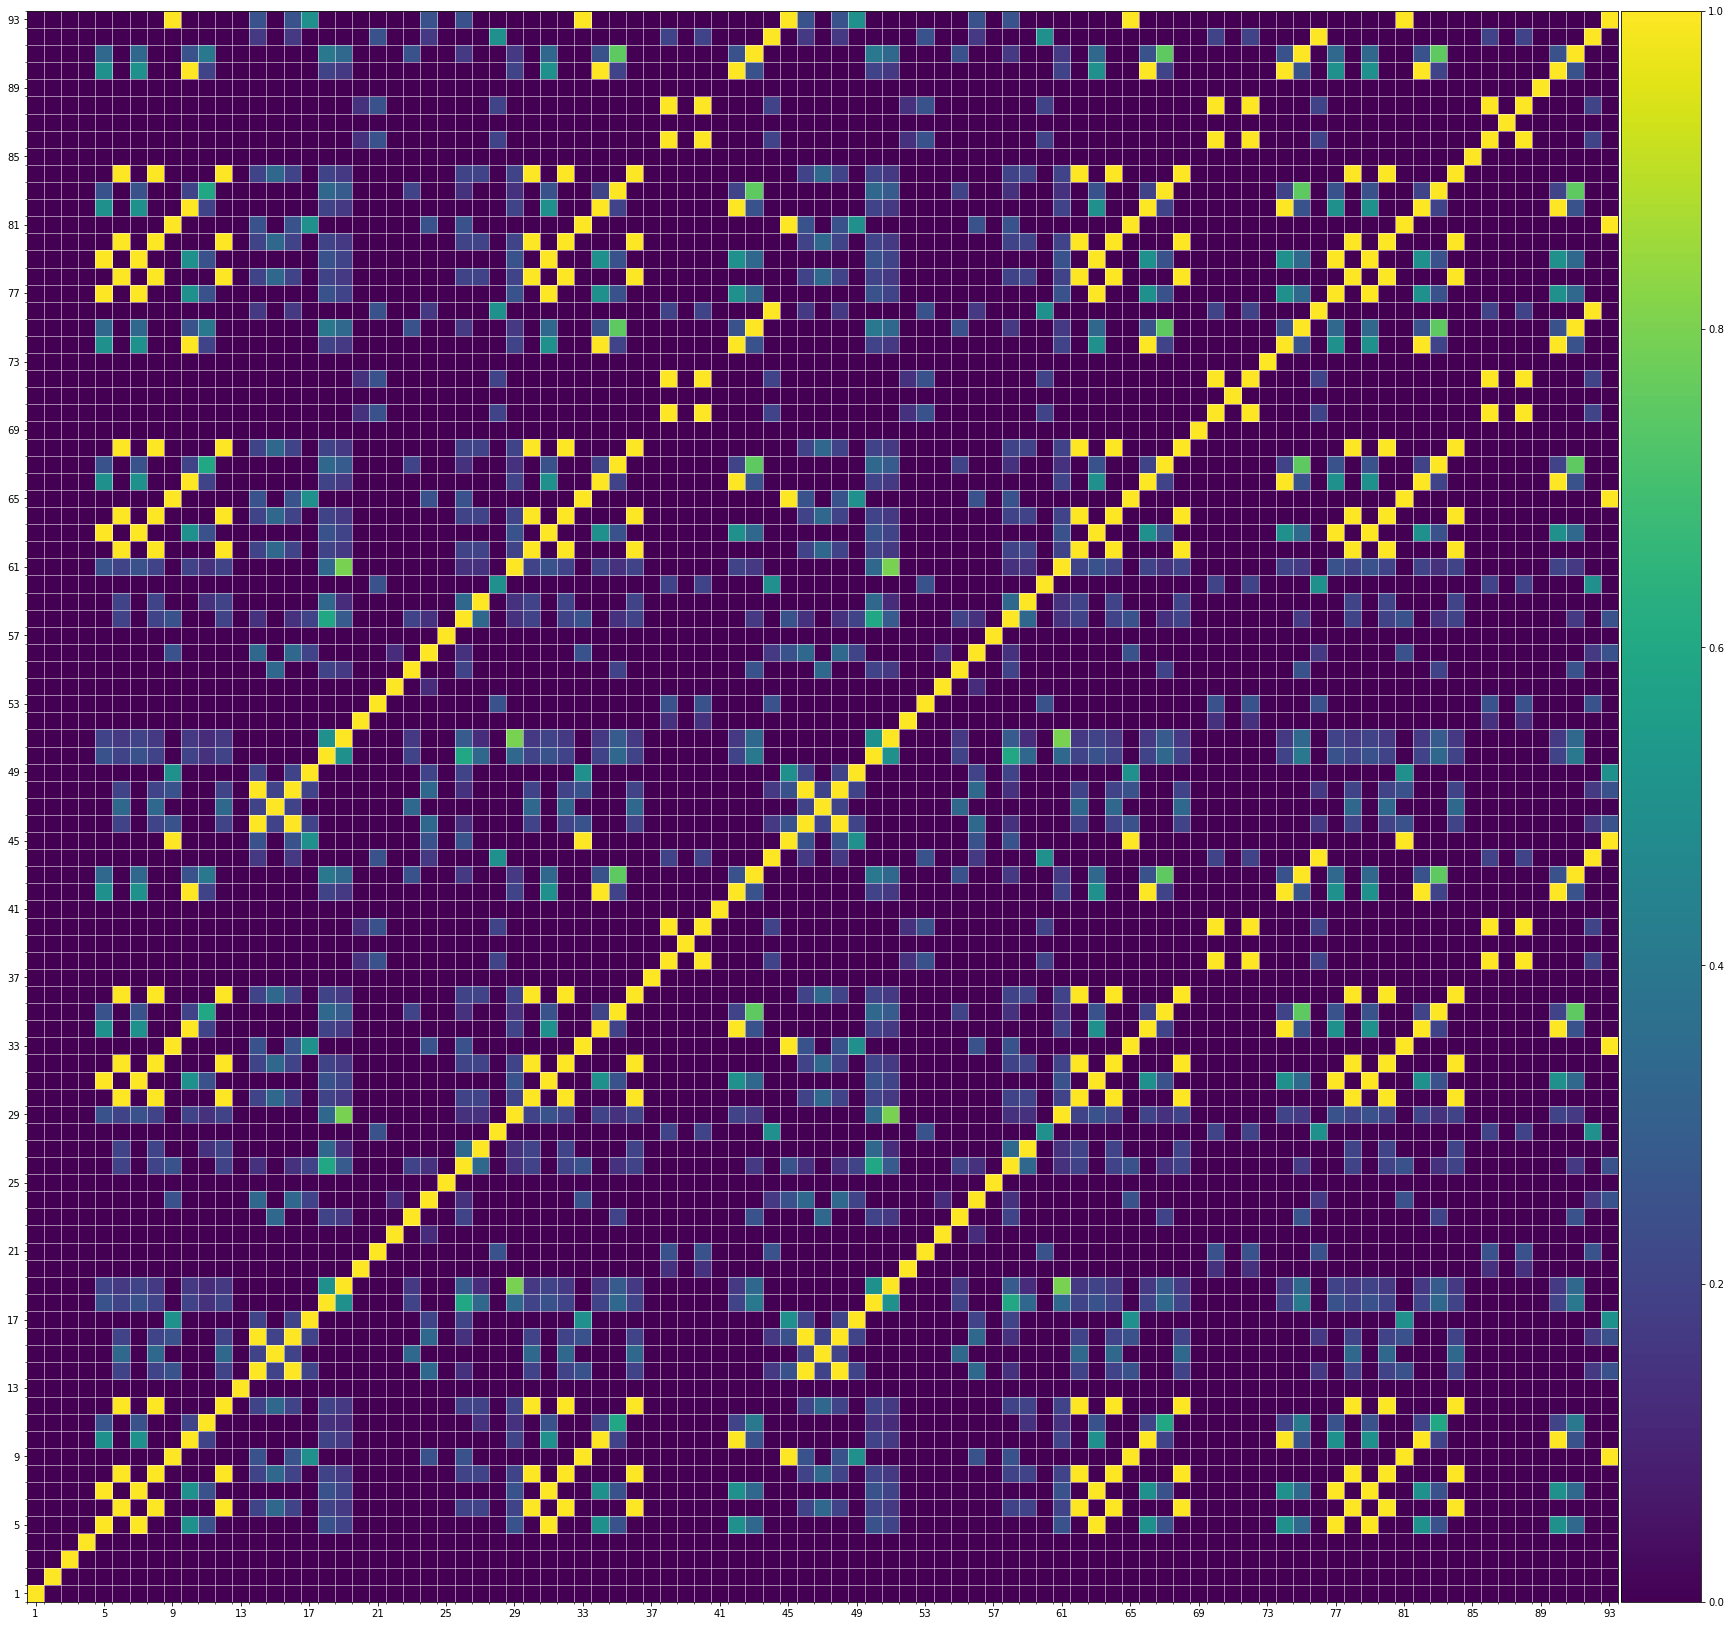
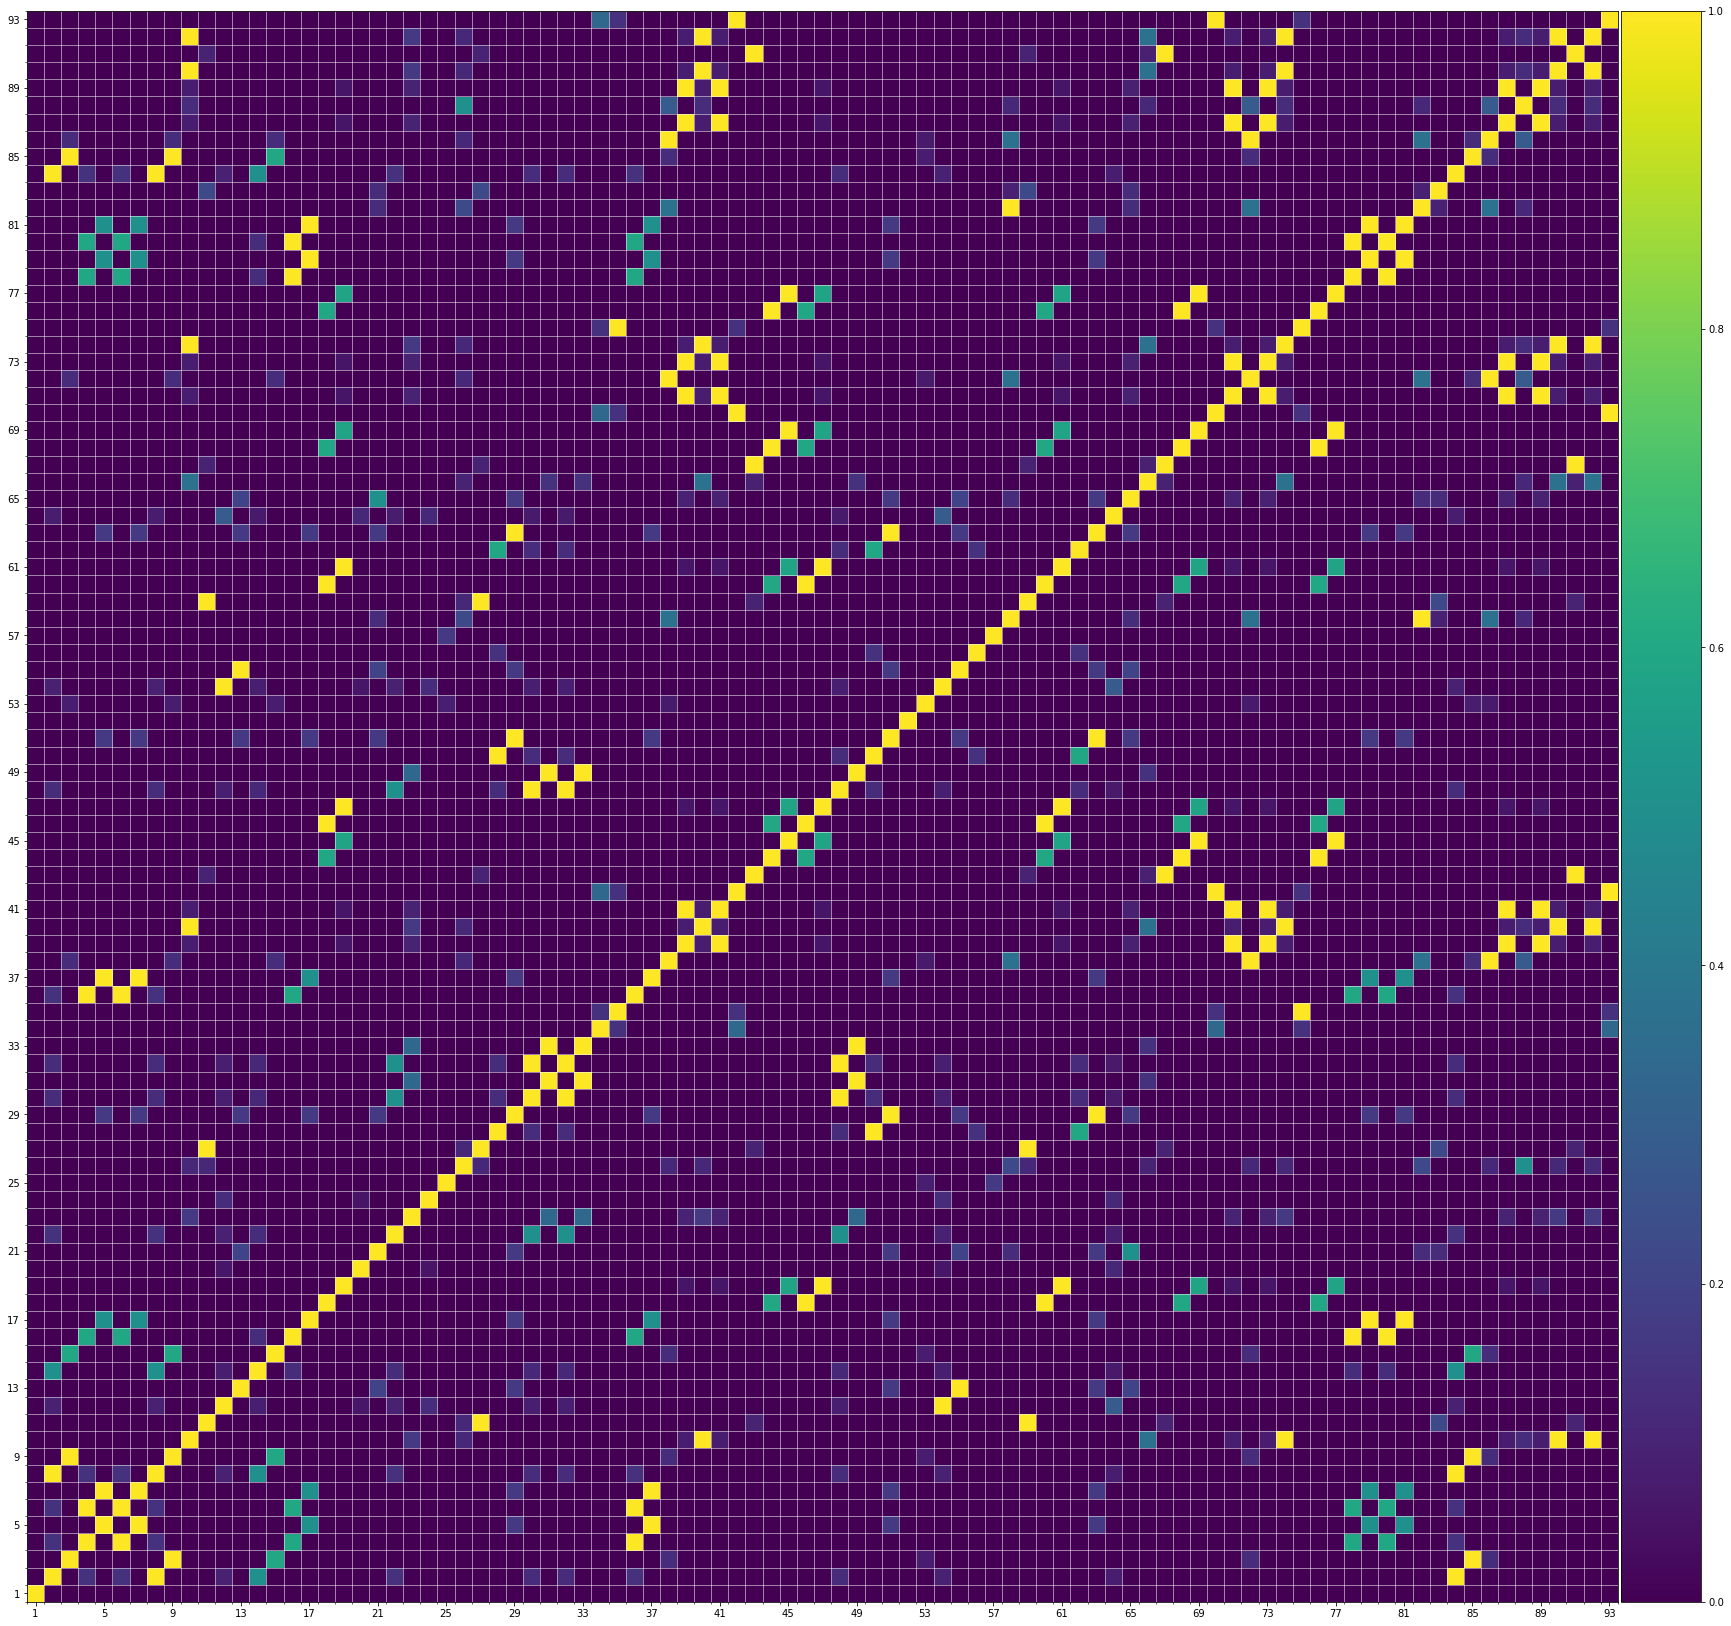
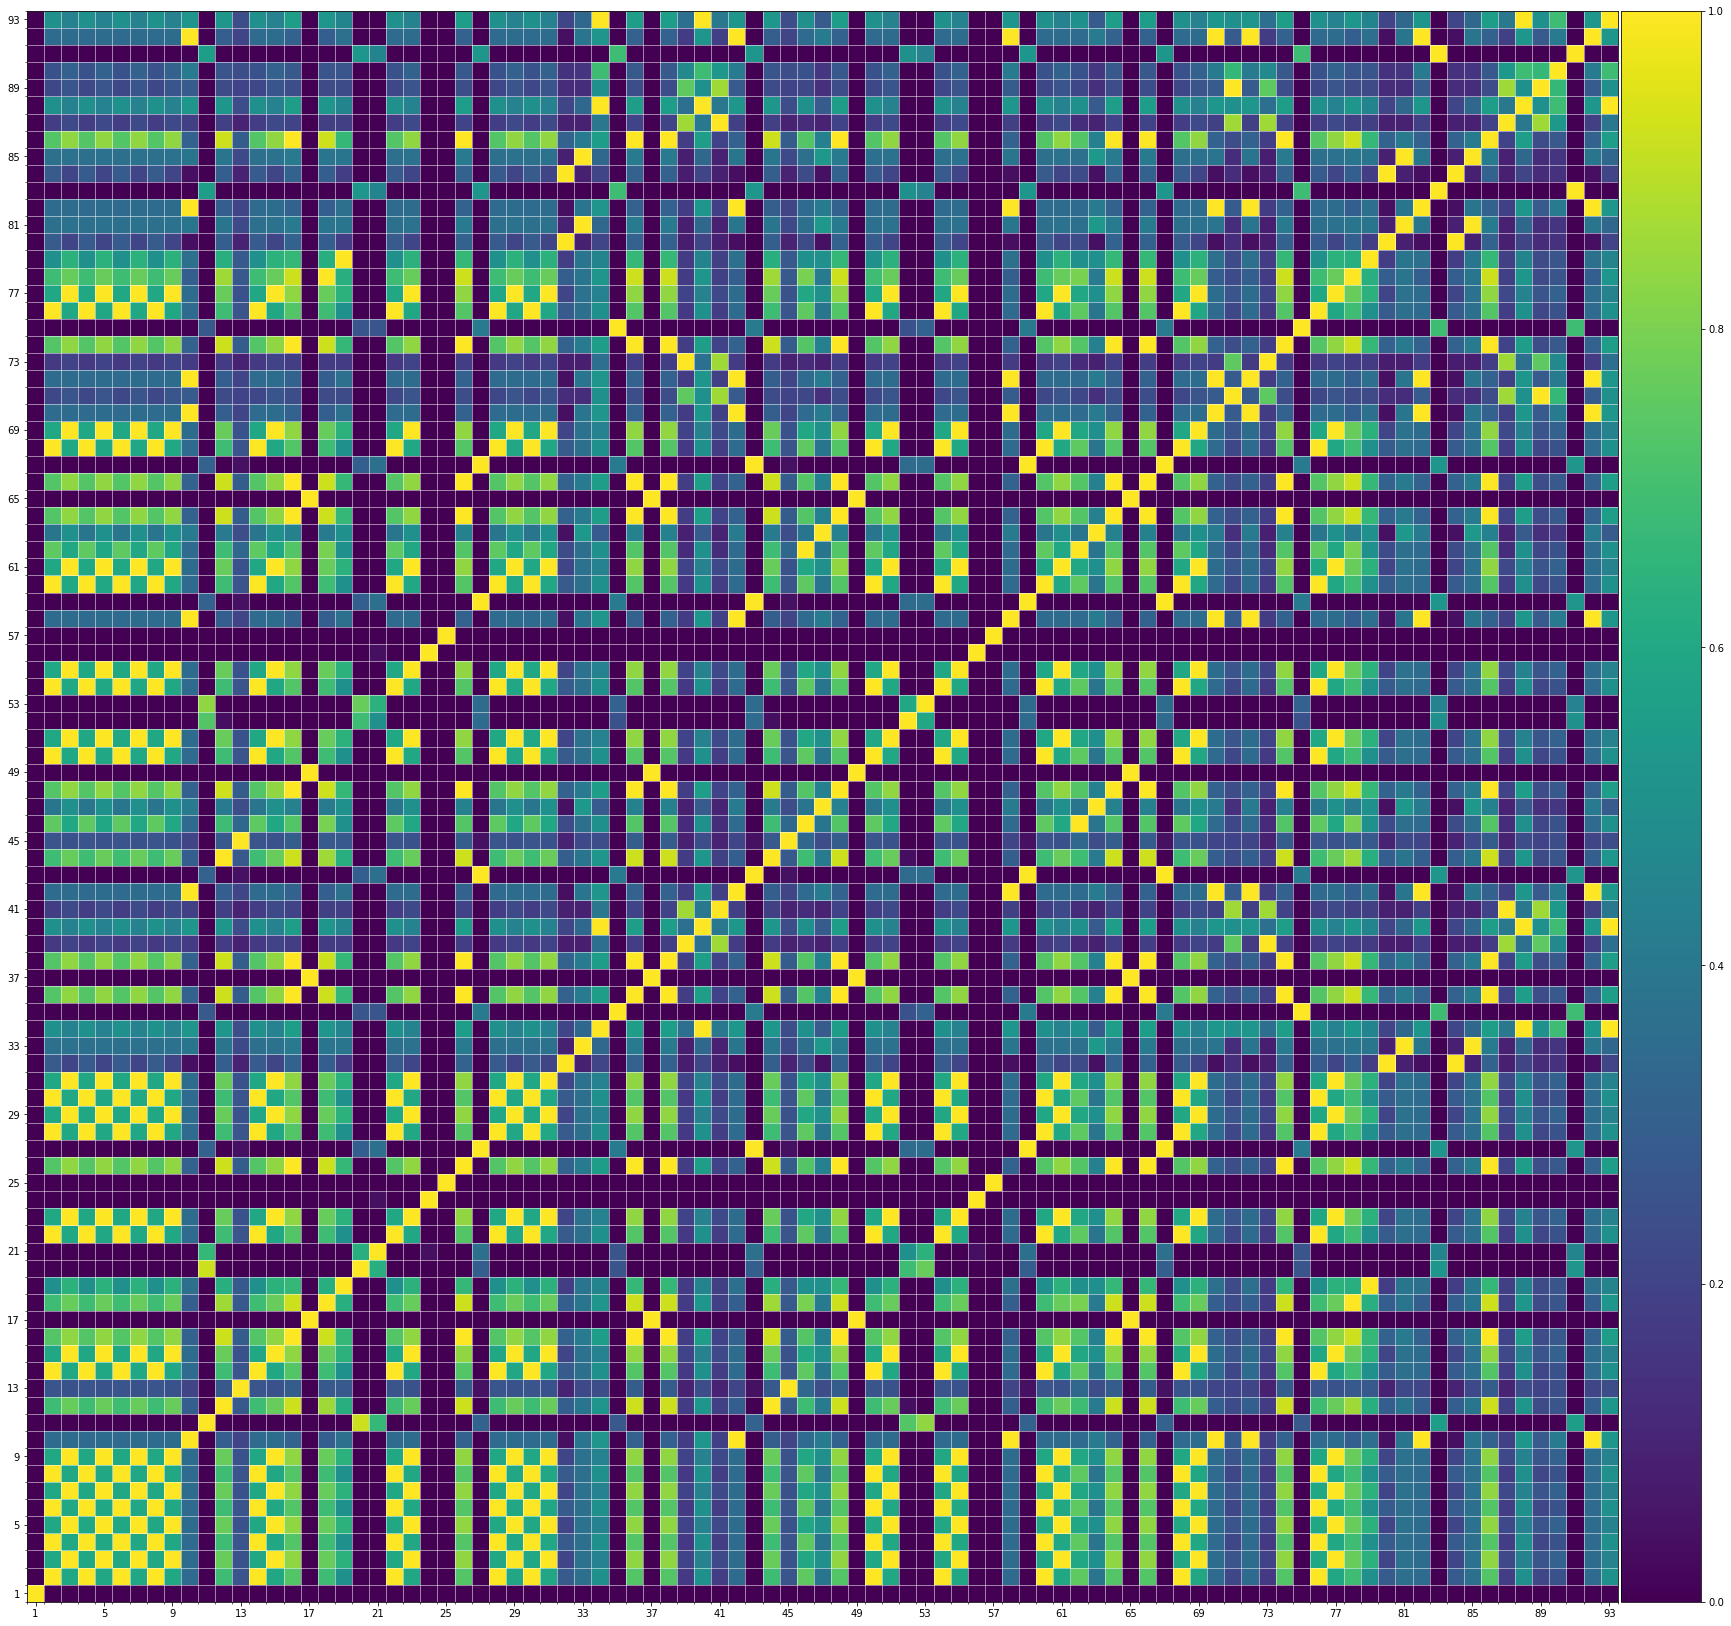
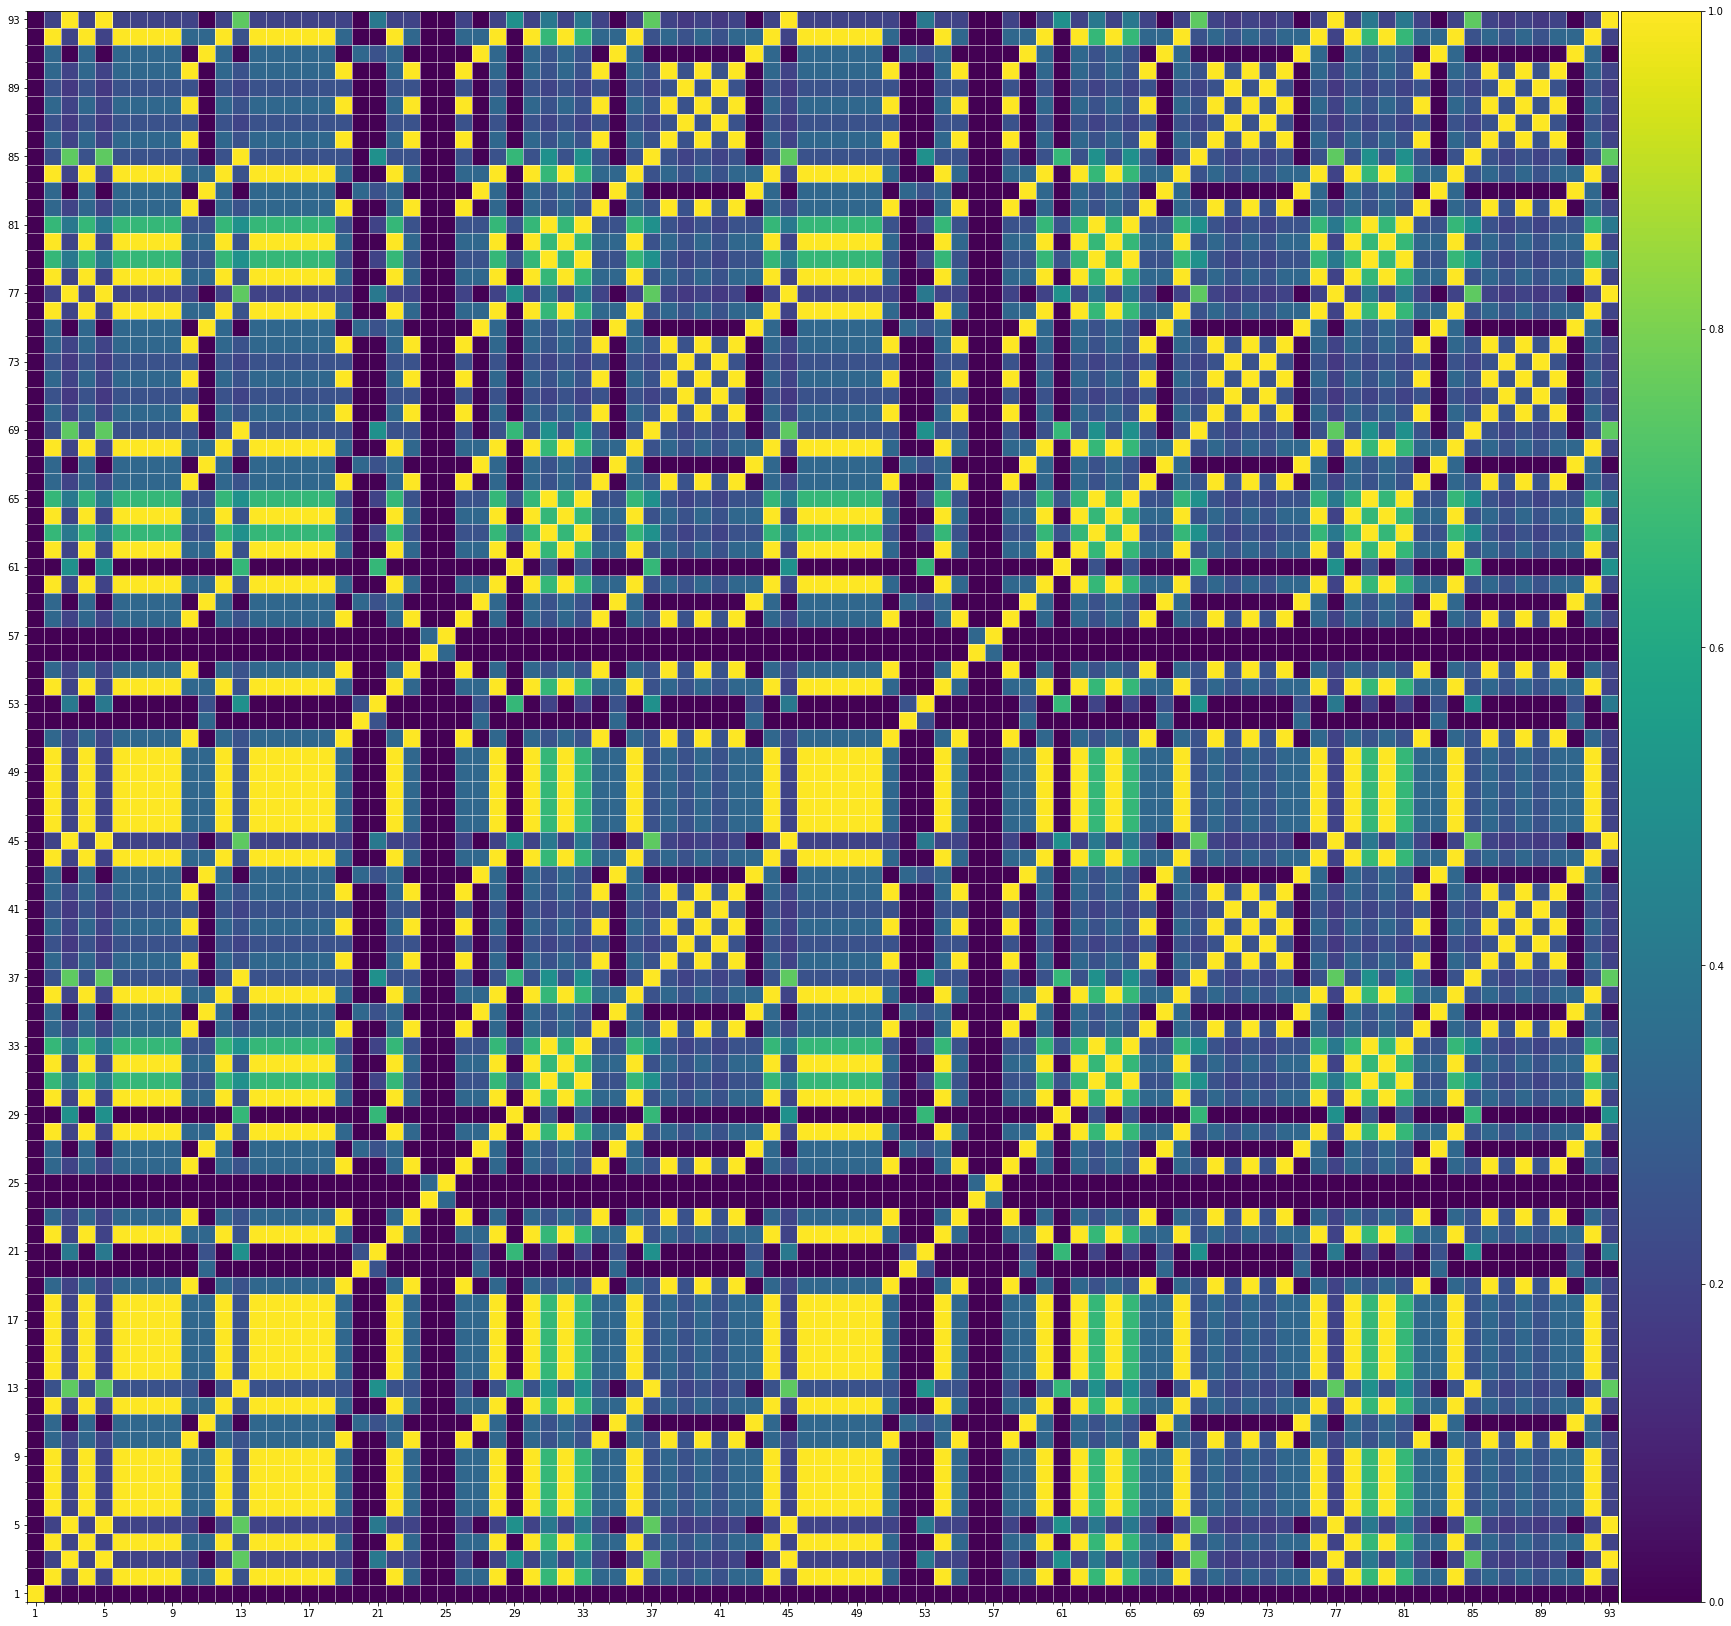
From the SSMs of the generated demos, we can see that there are many similar bars in the demos, and the music pieces tend to repeat or imitate the previous bars at the distance of 1, 2, 4, 8, ..., which manifests reasonable structures. Note that there are also many places where the similarities are larger than 0.0 and less than 1, and it means that these bars are similar and also have variations between them. If you watch the videos on the demo page, you will also find that there are many variations on the melody track, let alone that in many cases, the accompaniment tracks can be completely different for the similar melody. Therefore, Museformer can model both repetitions and variations, the combination of which makes good music structures of the generated music.
If we compare different tracks of a generated demo, we can see that, in general, the melody tends to repeat at a specific distance, while the accompaniment tracks usually follow a simple pattern and repeat more. This also fits our experiences in music. However, this is not always true for every song. For example, the bass track of demo 1 rarely repeat, which is mainly due to the bass is only played in a few bars. Also, the similarity pattern is different for every song, showing the diversity of music.
Also, we can see that the generated demos manifest similar characteristics to the training samples. It indicates that our method can successfully model the music structures.
Experiments on Maestro
Results
The following table shows the results of objective evaluation, where perplexity (PPL) is used as the metric.| PPL (1,024) | PPL (5,120) | PPL (10,240) | |
|---|---|---|---|
| Music Transformer | 5.04 | 10.92 | 13.17 |
| Transformer-XL | 4.16 | 4.17 | 4.18 |
| Longformer | 4.17 | 4.26 | 4.30 |
| Linear Transformer | 5.06 | 5.22 | 5.33 |
| Museformer (ours) | 4.16 | 4.12 | 4.12 |
| Musicality | ST Structure | LT Structure | Overall | |
|---|---|---|---|---|
| Music Transformer | 4.50±1.12 | 4.33±1.11 | 3.00±0.82 | 4.67±1.37 |
| Transformer-XL | 5.17±1.67 | 4.50±1.50 | 3.83±1.67 | 5.33±1.25 |
| Longformer | 5.00±1.53 | 4.67±0.75 | 3.33±1.11 | 5.00±1.63 |
| Linear Transformer | 4.83±1.57 | 4.00±1.15 | 3.50±1.26 | 4.83±2.27 |
| Museformer (ours) | 5.50±1.12 | 4.83±1.07 | 3.83±0.90 | 5.67±1.60 |
Analysis
The following figure shows the score of a MIDI file in the Maestro dataset. The note onsets and durations are not calibrated, which is an obvious problem existed in almost all samples in this dataset. This problem makes it hard to accurately model the music structures.
If anything is not clear enough to you, please feel free to ask us or have a discussion with us.
Thank you for everything 💗!